Jane Radetska (@centzontotochti) is web development team lead for pubmed.gov. Interested in performance of websites and development teams. Recently started to blog on web development topics. In free time loves to read books and dance lindy hop. @CheViana on github.
Web applications and API endpoints are known to perform backend calls. Often that is all application does: fetches data from a couple of backends, combines it, and produces response.
Monitoring how much time fetching data took is essential. There are plenty production-ready buy-and-snap-on solutions that provide such monitoring, but they might be not good fit for some cases. And I think it’s fun to dig deeper into things to get more understanding of how it all works.
Let’s look at code examples that use popular Python networking libraries and are instrumented to report HTTP request execution time.
What I’m going to explore in this post
I’m going to compare how request timings look for fetching HTML pages using requests library and for asynchronously fetching same HTML pages using aiohttp library. I aim to visualize the difference in timings, and to introduce tools that can be used for such monitoring.
To be fair, requests library has plugins that enable asynchronous IO and there are so many other ways to achieve this in Python… I picked aiohttp as it provides neat request timing tracing opportunities, and I use this library a lot in the wild.
To monitor request timings we will use Telegraf, InfluxDB and Grafana stack. These tools are very easy to setup locally, open source, free for personal usage, and could be used in production environment.
Running code examples section describes in detail how to run example code and setup monitoring infrastructure (Telegraf, InfluxDB, Grafana).
All code from this writing is available in repo.
Table of Contents
-
Monitoring network calls in Python using TIG stack
- What I’m going to explore in this post
- Table of Contents
-
Example 0: monitor
requestsrequest time - Example 0 improved: reuse connection
-
Example 1: monitor
aiohttprequest time - Example 2: more, more stats
-
Example 3:
aiohttpreuse session - Compare sync and async URL fetch, with and without reusing connection
- Histogram of request time
Example 0: monitor requests request time
Let’s dive into first Python code example. Here’s what it does:
- in forever loop, executes two HTTP requests using
requestsPython library - reports request time and request exceptions to Telegraf
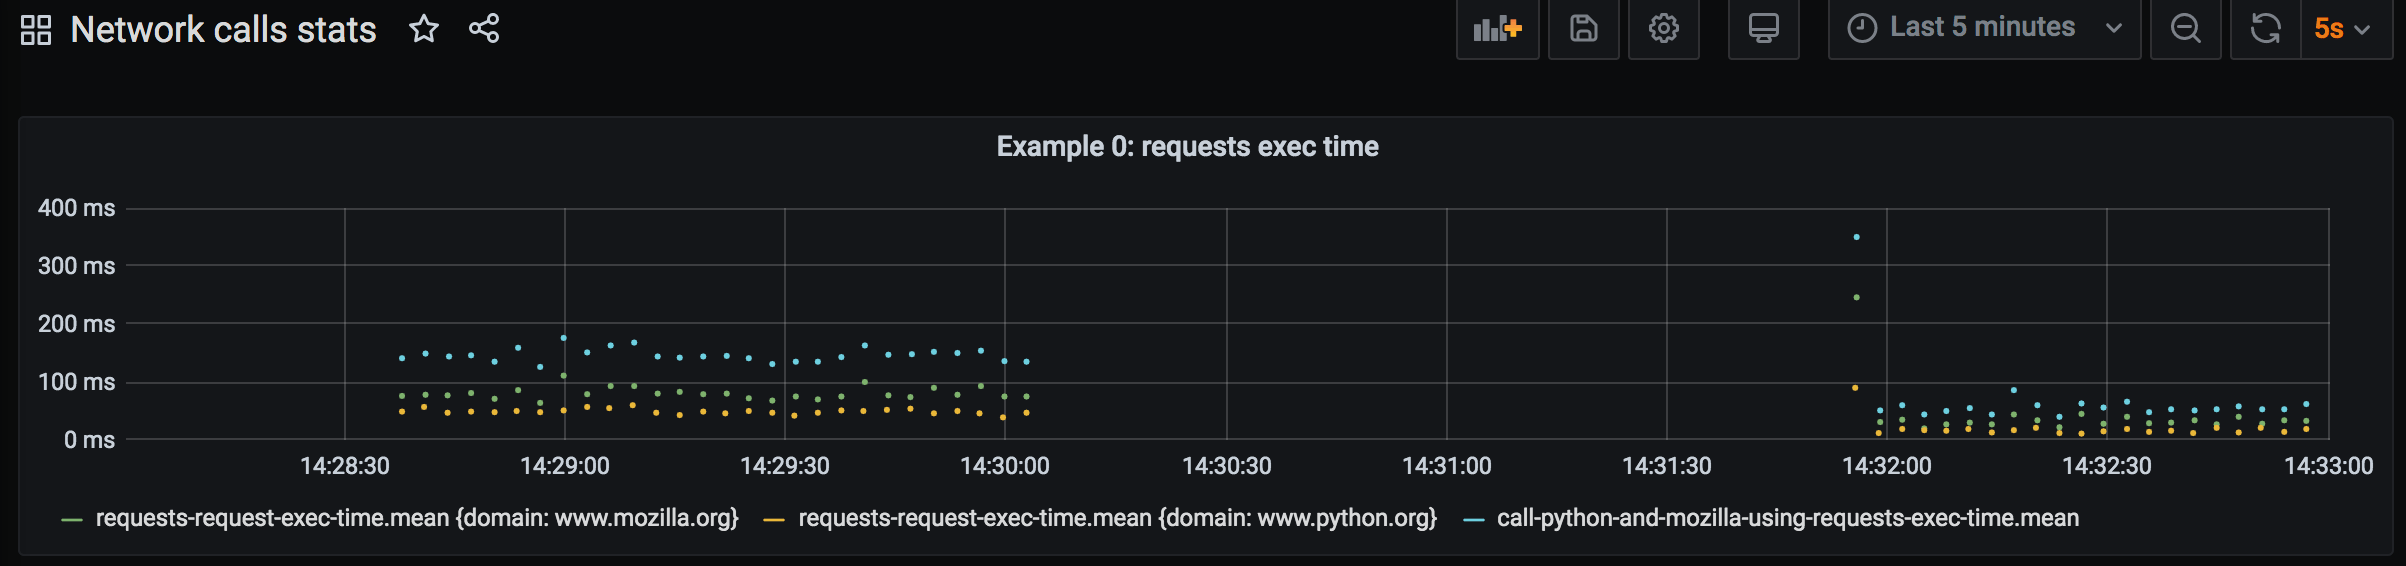
Here’s request execution time plotted on the dashboard:
Full code of Example 0 can be found in example-0-requests-send-stats.py.
High-level execution flow can be followed from main part of the program:
if __name__ == '__main__':
while True:
    result = call_python_and_mozilla_using_requests()
    print(result)
    time.sleep(3)
Inside call_python_and_mozilla_using_requests two simple HTTP requests are performed one by one, and their response text used to compose result:
def call_python_and_mozilla_using_requests():
py_response = get_response_text('https://www.python.org/')
moz_response = get_response_text('https://www.mozilla.org/en-US/')
return (
    f'Py response piece: {py_response[:60].strip()}... ,\n'
    f'Moz response piece: {moz_response[:60].strip()}...'
)
get_response_text function executes HTTP request for a given URL with primitive exception handling, and hooks to report request execution time:
def profile_request(start_time, response, *args, **kwargs):
elapsed_time = round((
    time.perf_counter() - start_time
) * 1000)
send_stats(
    'requests_request_exec_time',
    elapsed_time,
    {'domain': URL(response.url).raw_host}
)


def get_response_text(url):
try:
    request_complete_callback = partial(
        profile_request,
        time.perf_counter()
    )
    response = requests.get(
        url,
        hooks={'response': request_complete_callback}
    )
    response.raise_for_status()
    return response.content.decode()
except RequestException as e:
    send_stats(
        'requests_request_exception',
        1,
        {'domain': URL(url).raw_host, 'exception_class': e.__class__.__name__}
    )
    return f'Exception occurred: {e}'
This code uses requests library (docs). Basic usage to get text content from URL is as follows:
response = requests.get(url).content.decode()
requests.get accepts optional hooks argument, where function to be called after request is completed is specified – request_complete_callback.
This callback function may look funny if you’re not familiar with functional programming. partial(profile_request, time.perf_counter()) is itself a function. It’s same function as profile_request but the first argument is already filled in – time.perf_counter() was passed as start_time argument. This trick is used to supply correct start_time for each request, as request_complete_callback function is constructed anew for each request, while code for sending request execution time is isolated in another function profile_request. We can rewrite that as follows:
def get_response_text(url):
try:
    start_time = time.perf_counter()

    def profile_request(response, *args, **kwargs):
        elapsed_time = round((time.perf_counter() - start_time) * 1000)
        send_stats('requests_request_exec_time', elapsed_time, ...)

    response = requests.get(url, hooks={'response': profile_request})
And it’s going to work alright. Now there’s a function defined inside a function, and get_response_text is bloated with profiling stuff, which is not something I like.
You can read more about partial functions and Python functools.
time.perf_counter() is used to measure execution time in Python (docs). time.perf_counter() returns microseconds that are converted to milliseconds using * 1000.
Sending stats
send_stats function is used to report measurements to Telegraf: metric name is 'requests_request_exec_time', metric value is time request execution took, tags include additional useful information (domain of URL). get_response_text also invokes send_stats when exception occurs, passing different metric name this time – 'requests_request_exception'.
I have another post that describes ways to send stats from Python program to Telegraf.
In short, send_stats accepts metric name, metric value and tags dictionary. Those are converted to one string and sent to the socket on which Telegraf listens for measurement data. Telegraf sends received metrics to a database (InfluxDB). Grafana dashboard queries the database to put a dot on graph for each metric value reported.
profile decorator
A piece of code which is a decorator suitable for any function (async, sync, method of class or pure function) is adapted here to measure execution time of function that is decorated. profile decorator is used to profile total execution time of functions call_python_and_mozilla_using_requests and call_python_and_mozilla_using_aiohttp (see the following examples). Don’t confuse with another useful tool – line_profiler – that also provides profile decorator.
requests execution time on dashboard
Let’s run this example and set up all the monitoring tools. See Running code examples on how to run example code and set up monitoring infrastructure.
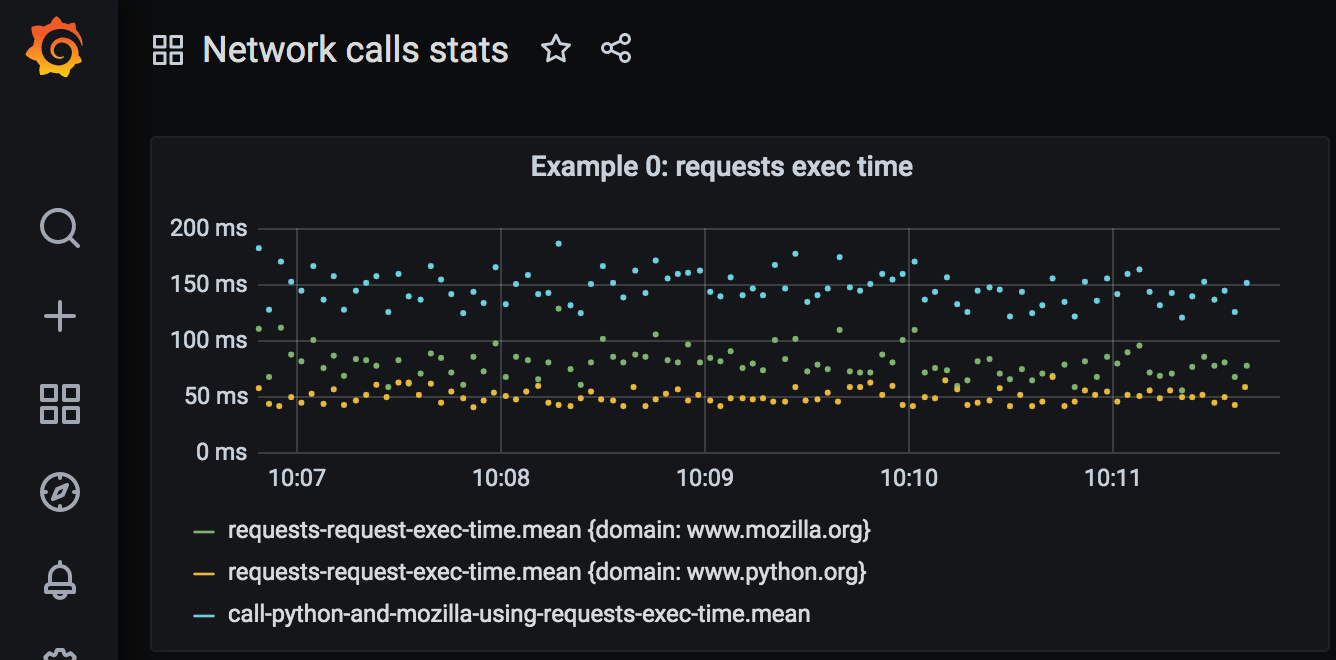
We can configure a panel that shows request execution time:
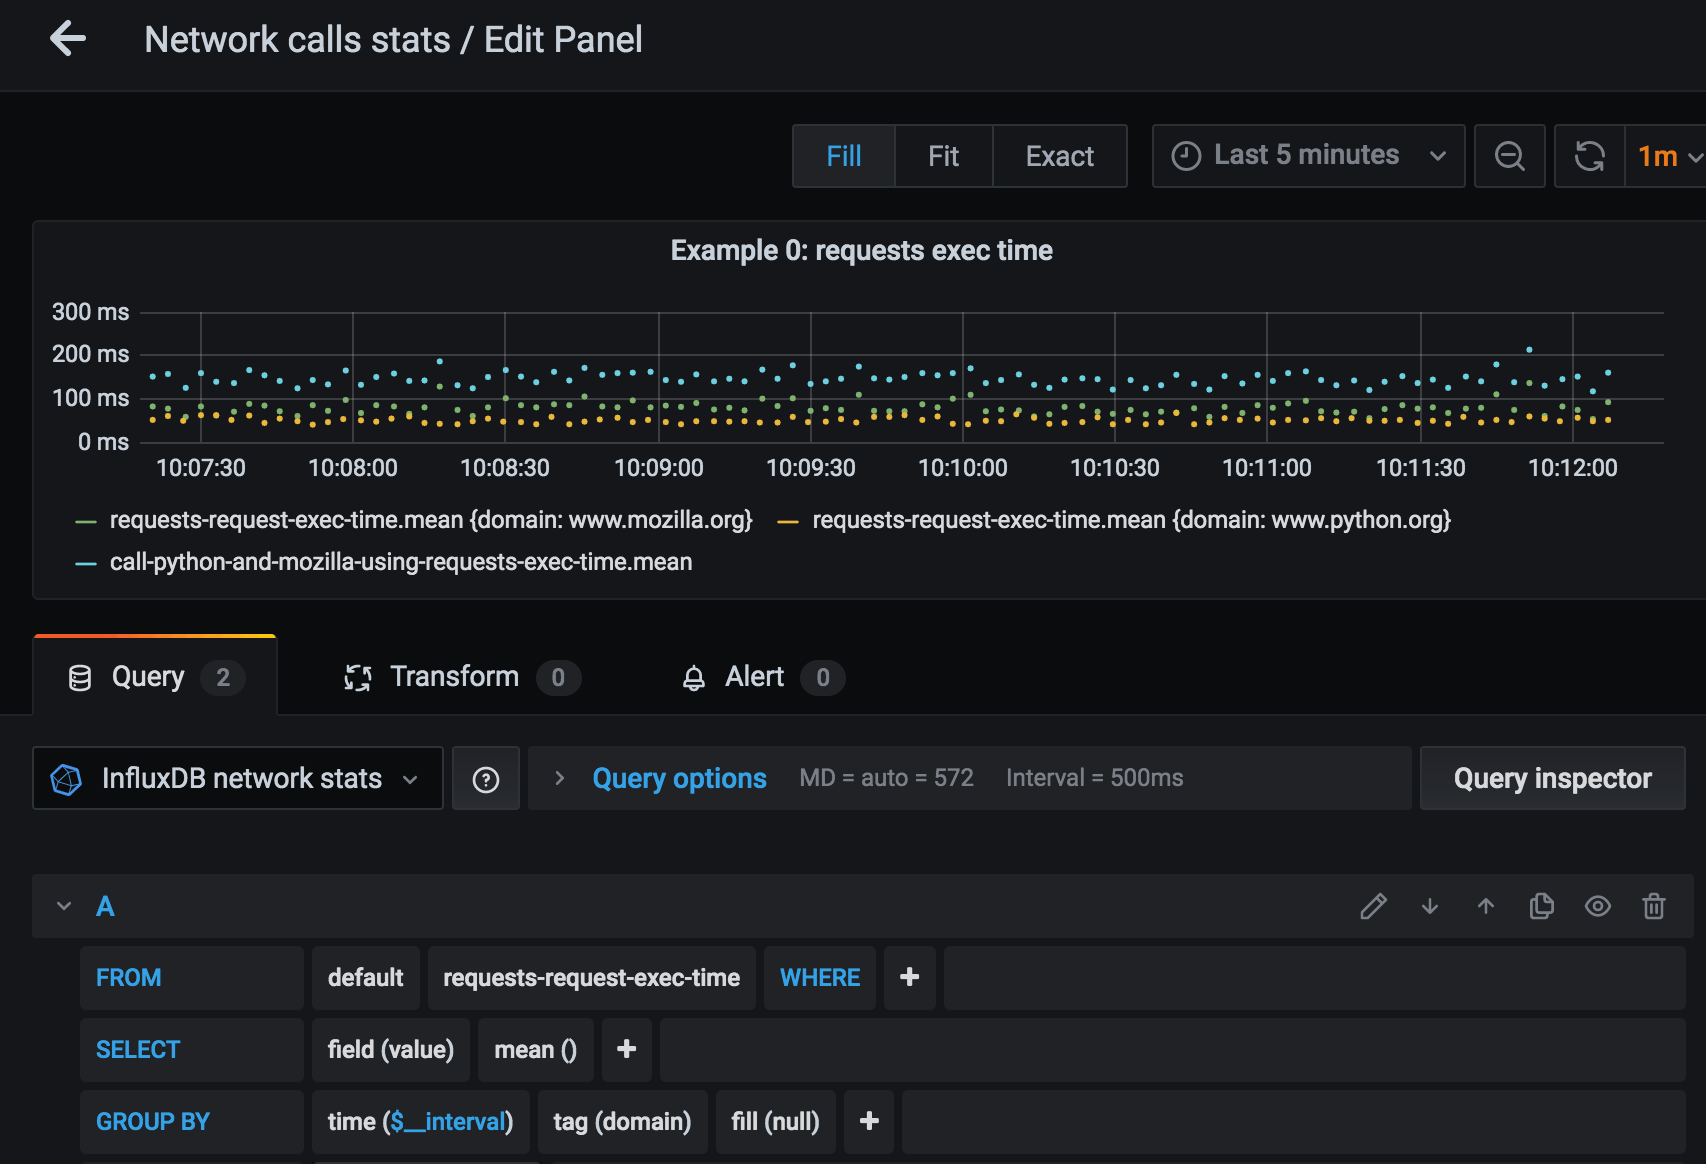
Blue dots of total execution time roughly correspond to the sum of time request to python.org and request to mozilla.org took (green and yellow dots). They measure at approximately 150 msec on average.
Need more exceptions
If we change ‘www.python.org‘ to ‘www.python1.org‘ in function call_python_and_mozilla_using_requests, exceptions appear in terminal output, and exception metrics are sent to Telegraf:
    Reported stats: aiohttp_request_exception=1, tags={'domain': 'www.python1.org', 'exception_class': 'ClientConnectorError'}
'Py response piece: ...Exception occurred: Cannot conn...
Configure a separate Grafana panel to see exceptions on the dashboard:
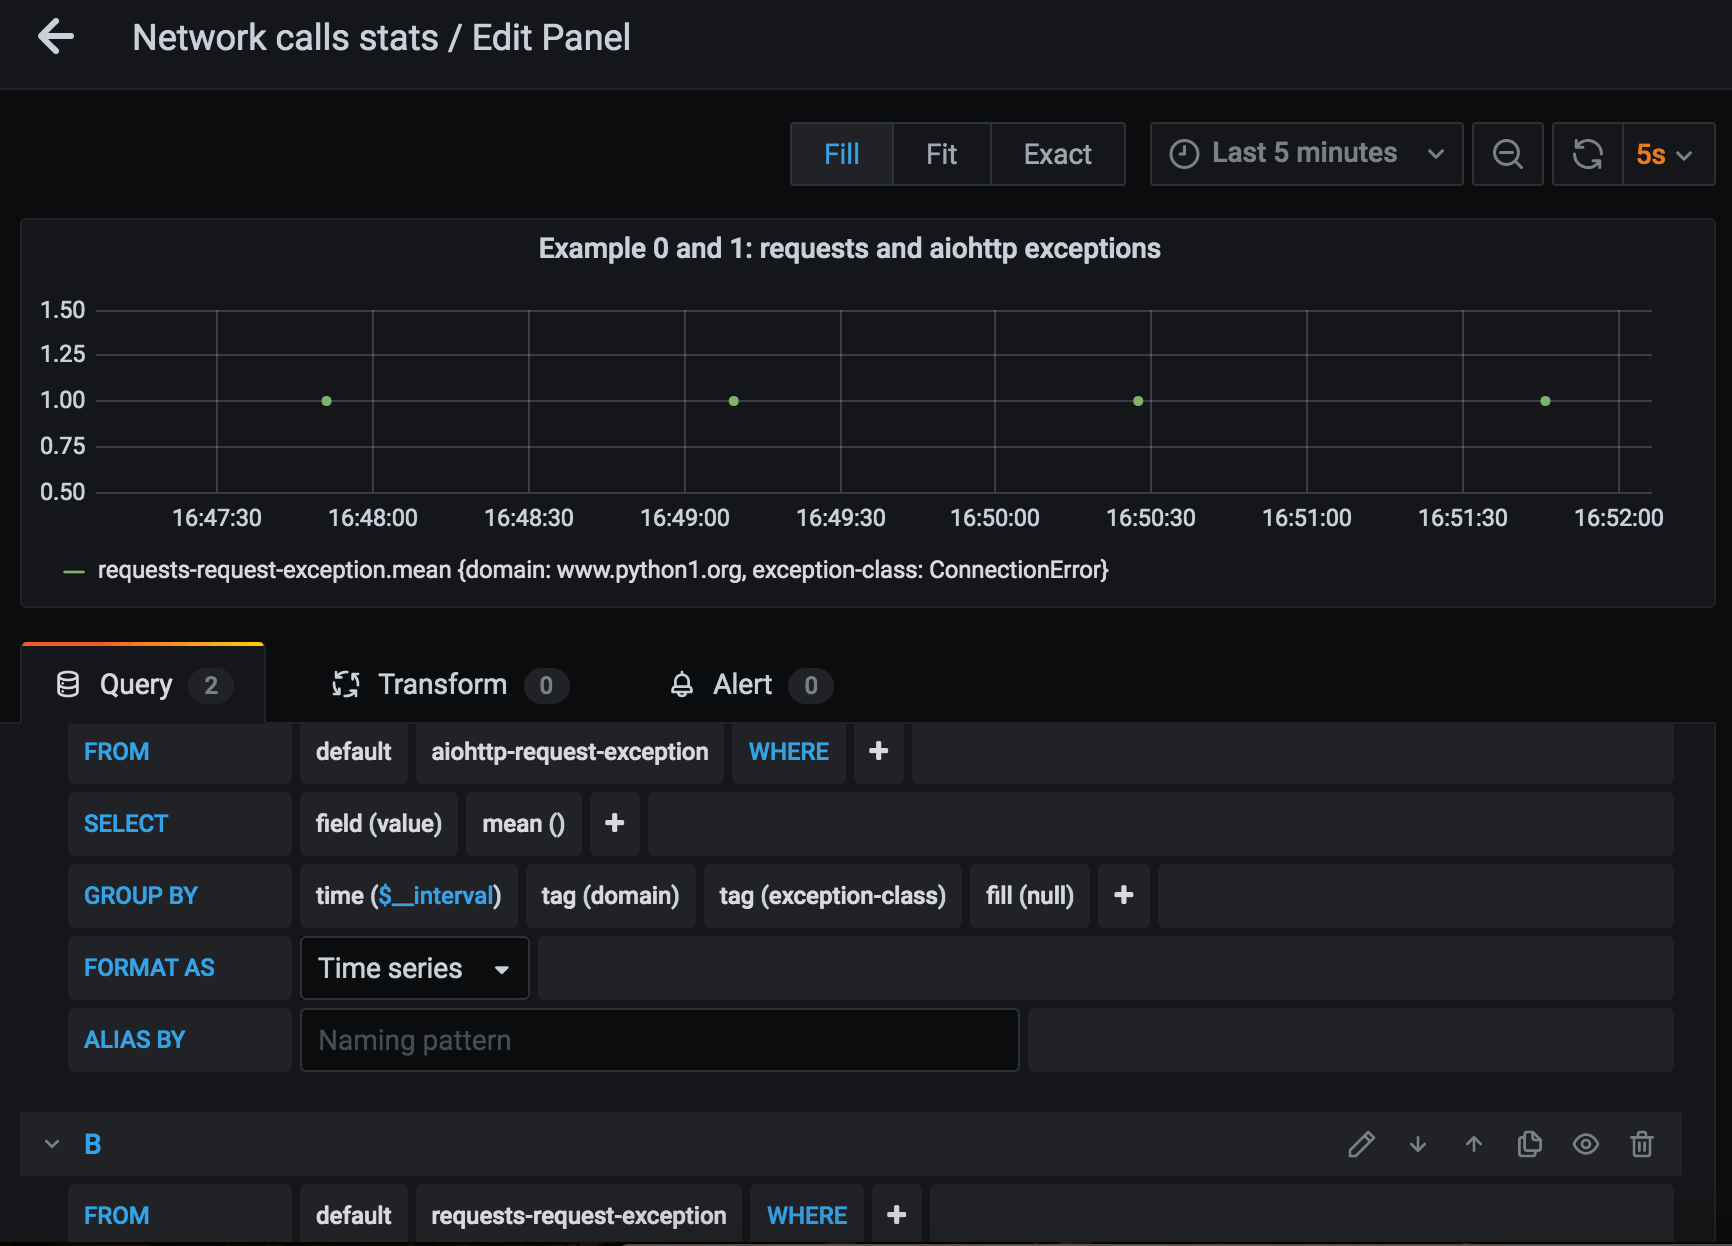
Exception class is sent as tag along with metric value. This gives us the ability to plot different lines for exceptions of different classes. To achieve this, pick ‘group by – tag(exception_class)’ when editing request exceptions panel.
Example 0 improved: reuse connection
Code of example 0 can be improved to reuse the same connection for all calls performed in that forever running while loop – here’s an improved version.
The only significant code change is this:
...
session = requests.Session()
while True:
    result = call_python_and_mozilla_using_requests(session)
...
Connection creation is moved out of the while loop. Now, the connection is established once and for all.
Let’s compare how much time request execution takes when a connection is reused:
The dots on the left are measurements for for original version of Example 0, and ones on the right came from the improved version. We can definitely notice how total execution time get lower, below 100 msec on average.
Example 1: monitor aiohttp request time
Let’s dive into the next code example. Here’s what it does:
- in forever loop, executes two asynchronous HTTP requests using
aiohttp - hooks into
aiohttprequest lifecycle signals - reports request time and request exceptions to Telegraf
Full code of Example 1 can be found in example-1-aiohttp-send-stats-basic.py.
High-level execution flow is similar to the Example 0, the way content is fetched from URLs differs.
The tale of two HTTP requests
Let’s start with the function call_python_and_mozilla_using_aiohttp that executes two asynchronous HTTP requests and returns pieces of response content. It is the sister of call_python_and_mozilla_using_requests from Example 0:
async def get_response_text(url):
    try:
        async with ClientSession(trace_configs=[Profiler()]) as session:
            async with session.get(url) as response:
                response.raise_for_status()
                return await response.text()
    except ClientError as e:
        return f'Exception occurred: {e}'

@profile
async def call_python_and_mozilla_using_aiohttp():
        py_response, moz_response = await asyncio.gather(
            get_response_text('https://www.python.org/'),
            get_response_text('https://www.mozilla.org/en-US/')
        )
        return (
            f'Py response piece: {py_response[:60].strip()}... ,\n'
            f'Moz response piece: {moz_response[:60].strip()}...'
        )
Here, aiohttp library’s ClientSession is used to execute the request (docs). Basic usage to get text content from URL is as follows:
async with ClientSession() as session:
    async with session.get(url) as response:
        return await response.text()
which is basically what happens in get_response_text. get_response_text also calls response.raise_for_status(), which raises exception when response status code is error code or timeout occurs . Exception is silenced in get_response_text, so get_response_text always returns str, either with response content or with exception message.
call_python_and_mozilla_using_aiohttp takes care of callings two URLs using asyncio.gather. Execution order for call_python_and_mozilla_using_aiohttp is on the right:
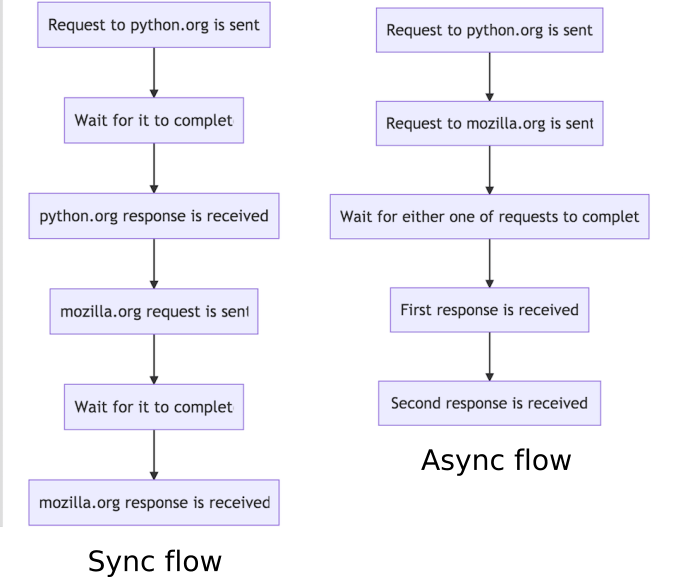
await asyncio.gather returns the result after both of these requests are complete. Total execution time is approximately the time of the longest request out of these two. You’re probably aware that this is called non-blocking IO. Instead of blocking, this kind of IO operation frees execution thread until it needs it again.
Synchronous, blocking IO, like in Example 0, has different following execution order (see chart above, on the left). Total execution time is approximately the sum of both requests execution time. For positive integers, it’s always true that A + B > MAX(A, B). Hence, asynchronous execution takes less time than synchronous one, provided unlimited CPU was available in both cases.
On the panel that shows requests execution time and their total execution time, it’s possible to notice that total execution time call_python_and_mozilla_using_aiohttp_exec_time almost matches the longer-executing request time: 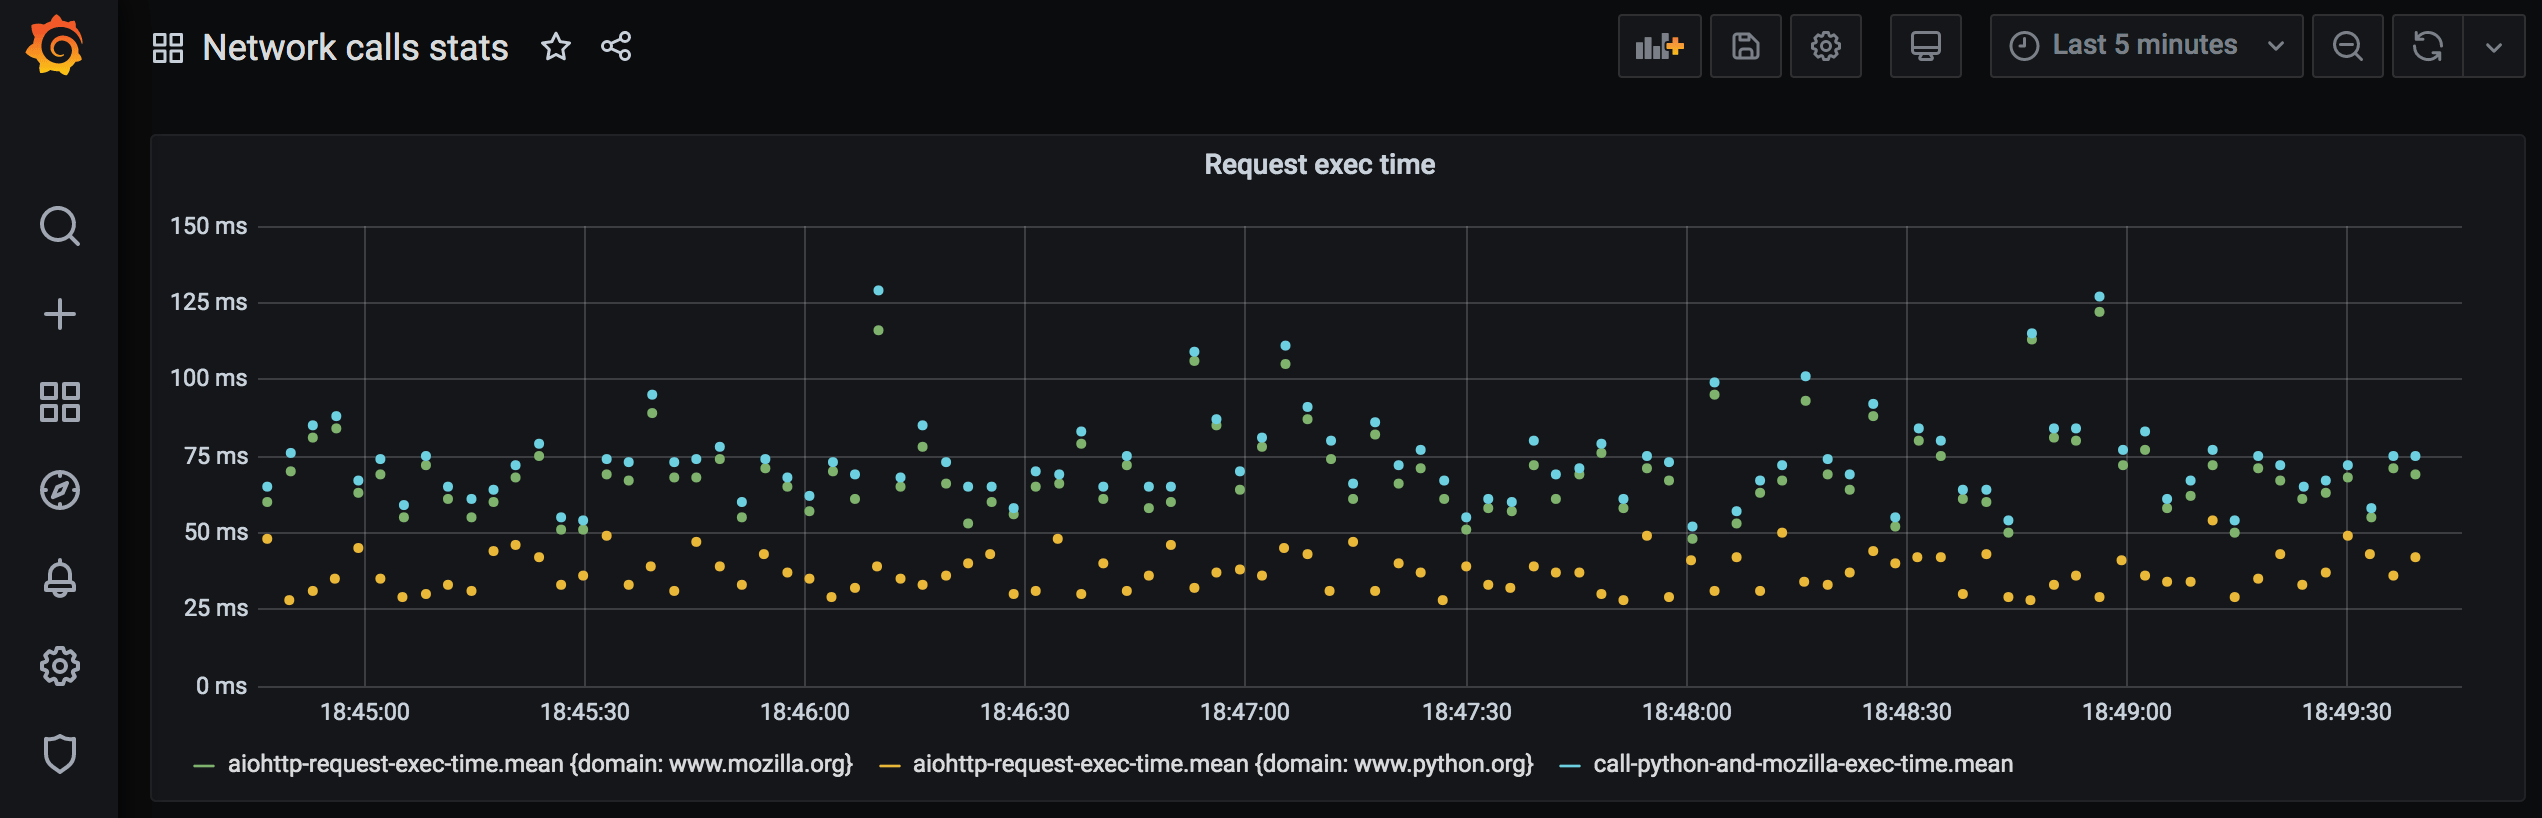
The total execution time for both requests is 75-100 msec.
Next, we’re going to look at how execution time of each aiohttp request is reported.
aiohttp requests signals
aiohttp provides a way to execute a custom function when HTTP request execution progresses through lifecycle stages: before request is sent, when connection is established, after response chunk is received, etc. For that, object-tracer is passed to aiohttp.ClientSession – trace_configs:
class Profiler(TraceConfig):
    def __init__(self, *args, **kwargs):
        super().__init__(*args, **kwargs)
        self.on_request_start.append(on_request_start)
        self.on_request_end.append(on_request_end)
        self.on_request_exception.append(on_request_exception)

...
async with ClientSession(trace_configs=[Profiler()]) as session:
...
Profiler is a subclass of aiohttp.TraceConfig. It “hooks up” functions that are going to be executed when request starts (on_request_start), when it ends (on_request_end) and when request exception is encountered (on_request_exception):
async def on_request_start(session, trace_config_ctx, params):
    trace_config_ctx.request_start = asyncio.get_event_loop().time()

async def on_request_end(session, trace_config_ctx, params):
    elapsed_time = round((
        asyncio.get_event_loop().time() - trace_config_ctx.request_start
    ) * 1000)
    send_stats(
        'aiohttp_request_exec_time',
        elapsed_time,
        {'domain': params.url.raw_host}
    )

async def on_request_exception(session, trace_config_ctx, params):
    send_stats(
        'aiohttp_request_exception',
        1,
        {'domain': params.url.raw_host, 'exception_class': params.exception.__class__.__name__}
    )
Notice how the timestamp is computed:
asyncio.get_event_loop().time()
It is recommended to use event loop’s internal monotonic clock to compute time delta in asynchronous code.
Function-hooks have arguments session, trace_config_ctx, params. Let’s look at what they are.
session is an instance of aiohttp.ClientSession.
trace_config_ctx is context that is passed through callbacks. Custom values call be added to it when request is made:
await session.get(url, trace_request_ctx={'flag': 'red'})
...

async def on_request_end(session, trace_config_ctx, params):
    if trace_config_ctx.trace_request_ctx['flag'] == 'red':
        ....
This way function-hook can be programmed to behave differently for different request calls or to report additional data.
Request end hook uses trace_config_ctx.request_start value to compute total time request took. trace_config_ctx.request_start is set in request start hook.
params argument in on_request_end is aiohttp.TraceRequestEndParams and as such has url property. url property is of yarl.URL type. params.url.raw_host returns the domain of the URL that was requested. Domain is sent as a tag for metric, and this makes it possible to plot separate lines for different URLs.
Calling asynchronous code from synchronous
To call async function in sync execution context, special tooling is used, which is adapted from another publication. I’m not going to dive into Python’s asynchronous ways in this post. Read more about Python’s asyncio, it’s pretty cool.
Compare results for Example 0 and 1
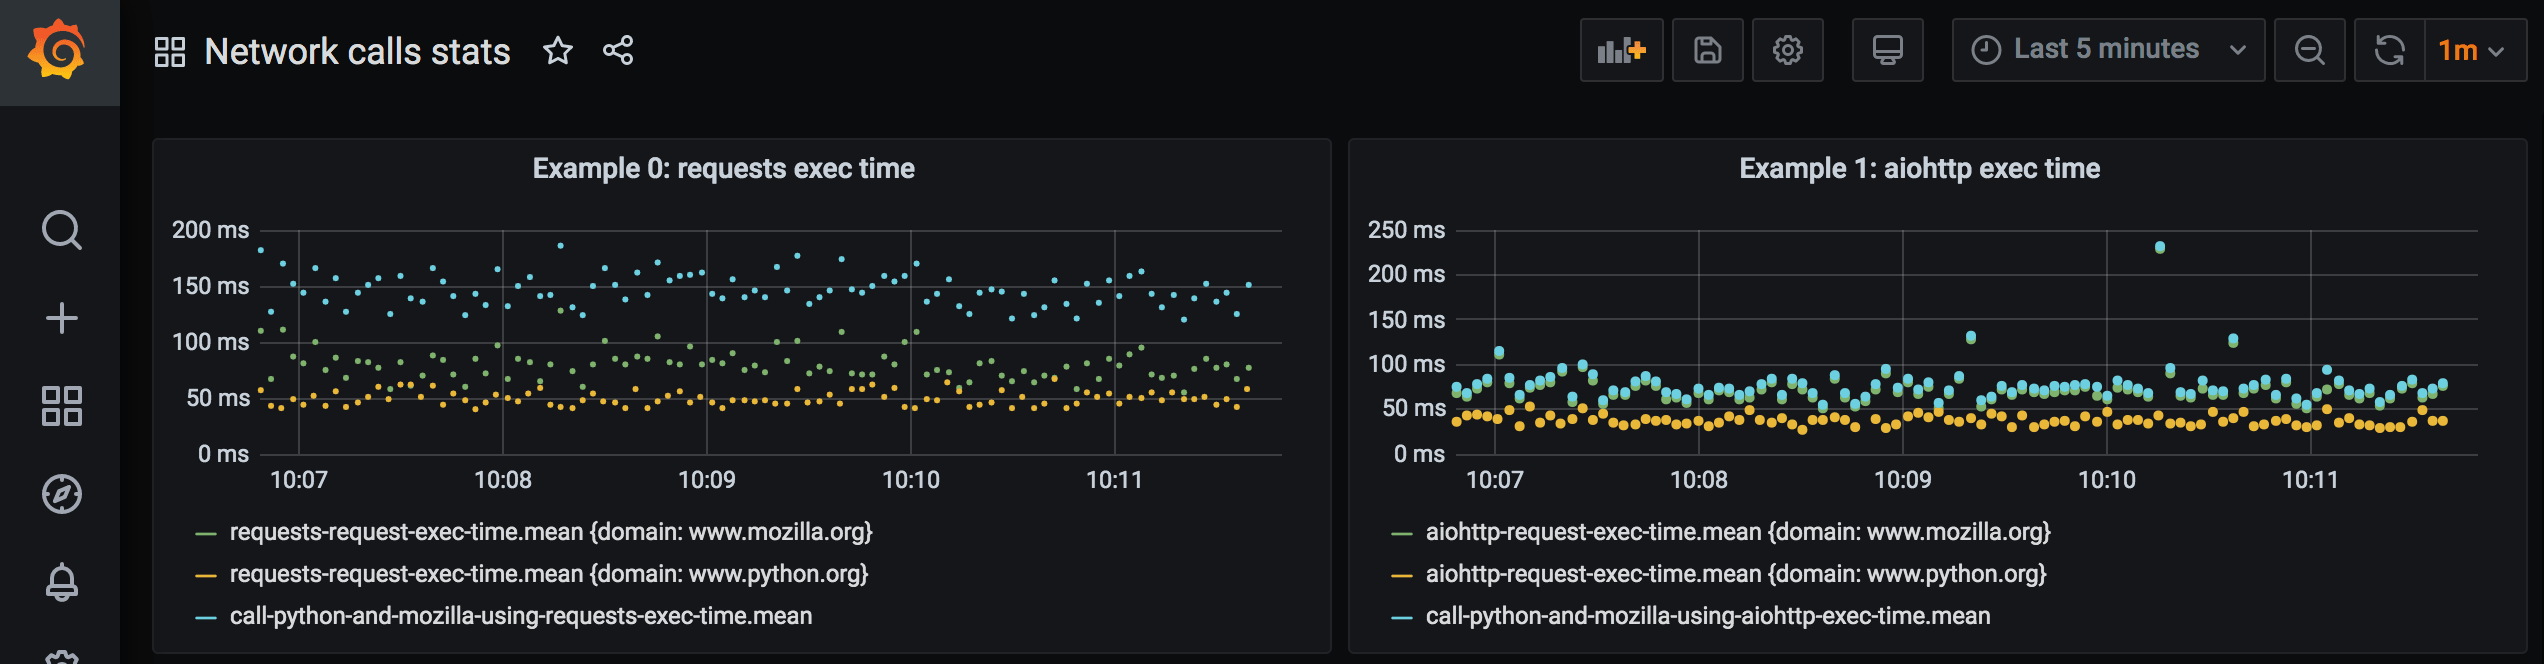
Connection is not reused for both cases here. Execution time for async version is lower, as expected.
Example 2: more, more stats
aiohttp provides hooks to measure more than just request execution time and request exceptions.
It’s possible to report stats for:
- DNS resolution time
- DNS cache hit/miss
- waiting for available connection time
- connection establishing time
- connection being reused
- redirect happening
- response content chunk received
- request chunk sent
Impressive, isn’t it? Documentation on tracing in aiohttp is here.
Let’s add more request lifecycle hooks:
class Profiler(TraceConfig):
    def __init__(self, *args, **kwargs):
        super().__init__(*args, **kwargs)
        self.on_request_start.append(on_request_start)
        self.on_request_end.append(on_request_end)
        self.on_request_redirect.append(on_request_redirect)
        self.on_request_exception.append(on_request_exception)
        self.on_connection_queued_start.append(on_connection_queued_start)
        self.on_connection_queued_end.append(on_connection_queued_end)
        self.on_connection_create_start.append(on_connection_create_start)
        self.on_connection_create_end.append(on_connection_create_end)
        self.on_dns_resolvehost_start.append(on_dns_resolvehost_start)
        self.on_dns_resolvehost_end.append(on_dns_resolvehost_end)
        self.on_response_chunk_received.append(on_response_chunk_received)
        self.on_connection_reuseconn.append(on_connection_reuseconn)
        self.on_dns_cache_hit.append(on_dns_cache_hit)
        self.on_dns_cache_miss.append(on_dns_cache_miss)
I won’t bore you with code for each function like on_dns_resolvehost_end, it’s quite similar to on_request_end. Full code of Example 2 is here.
Reported stats on dashboard for example 2:
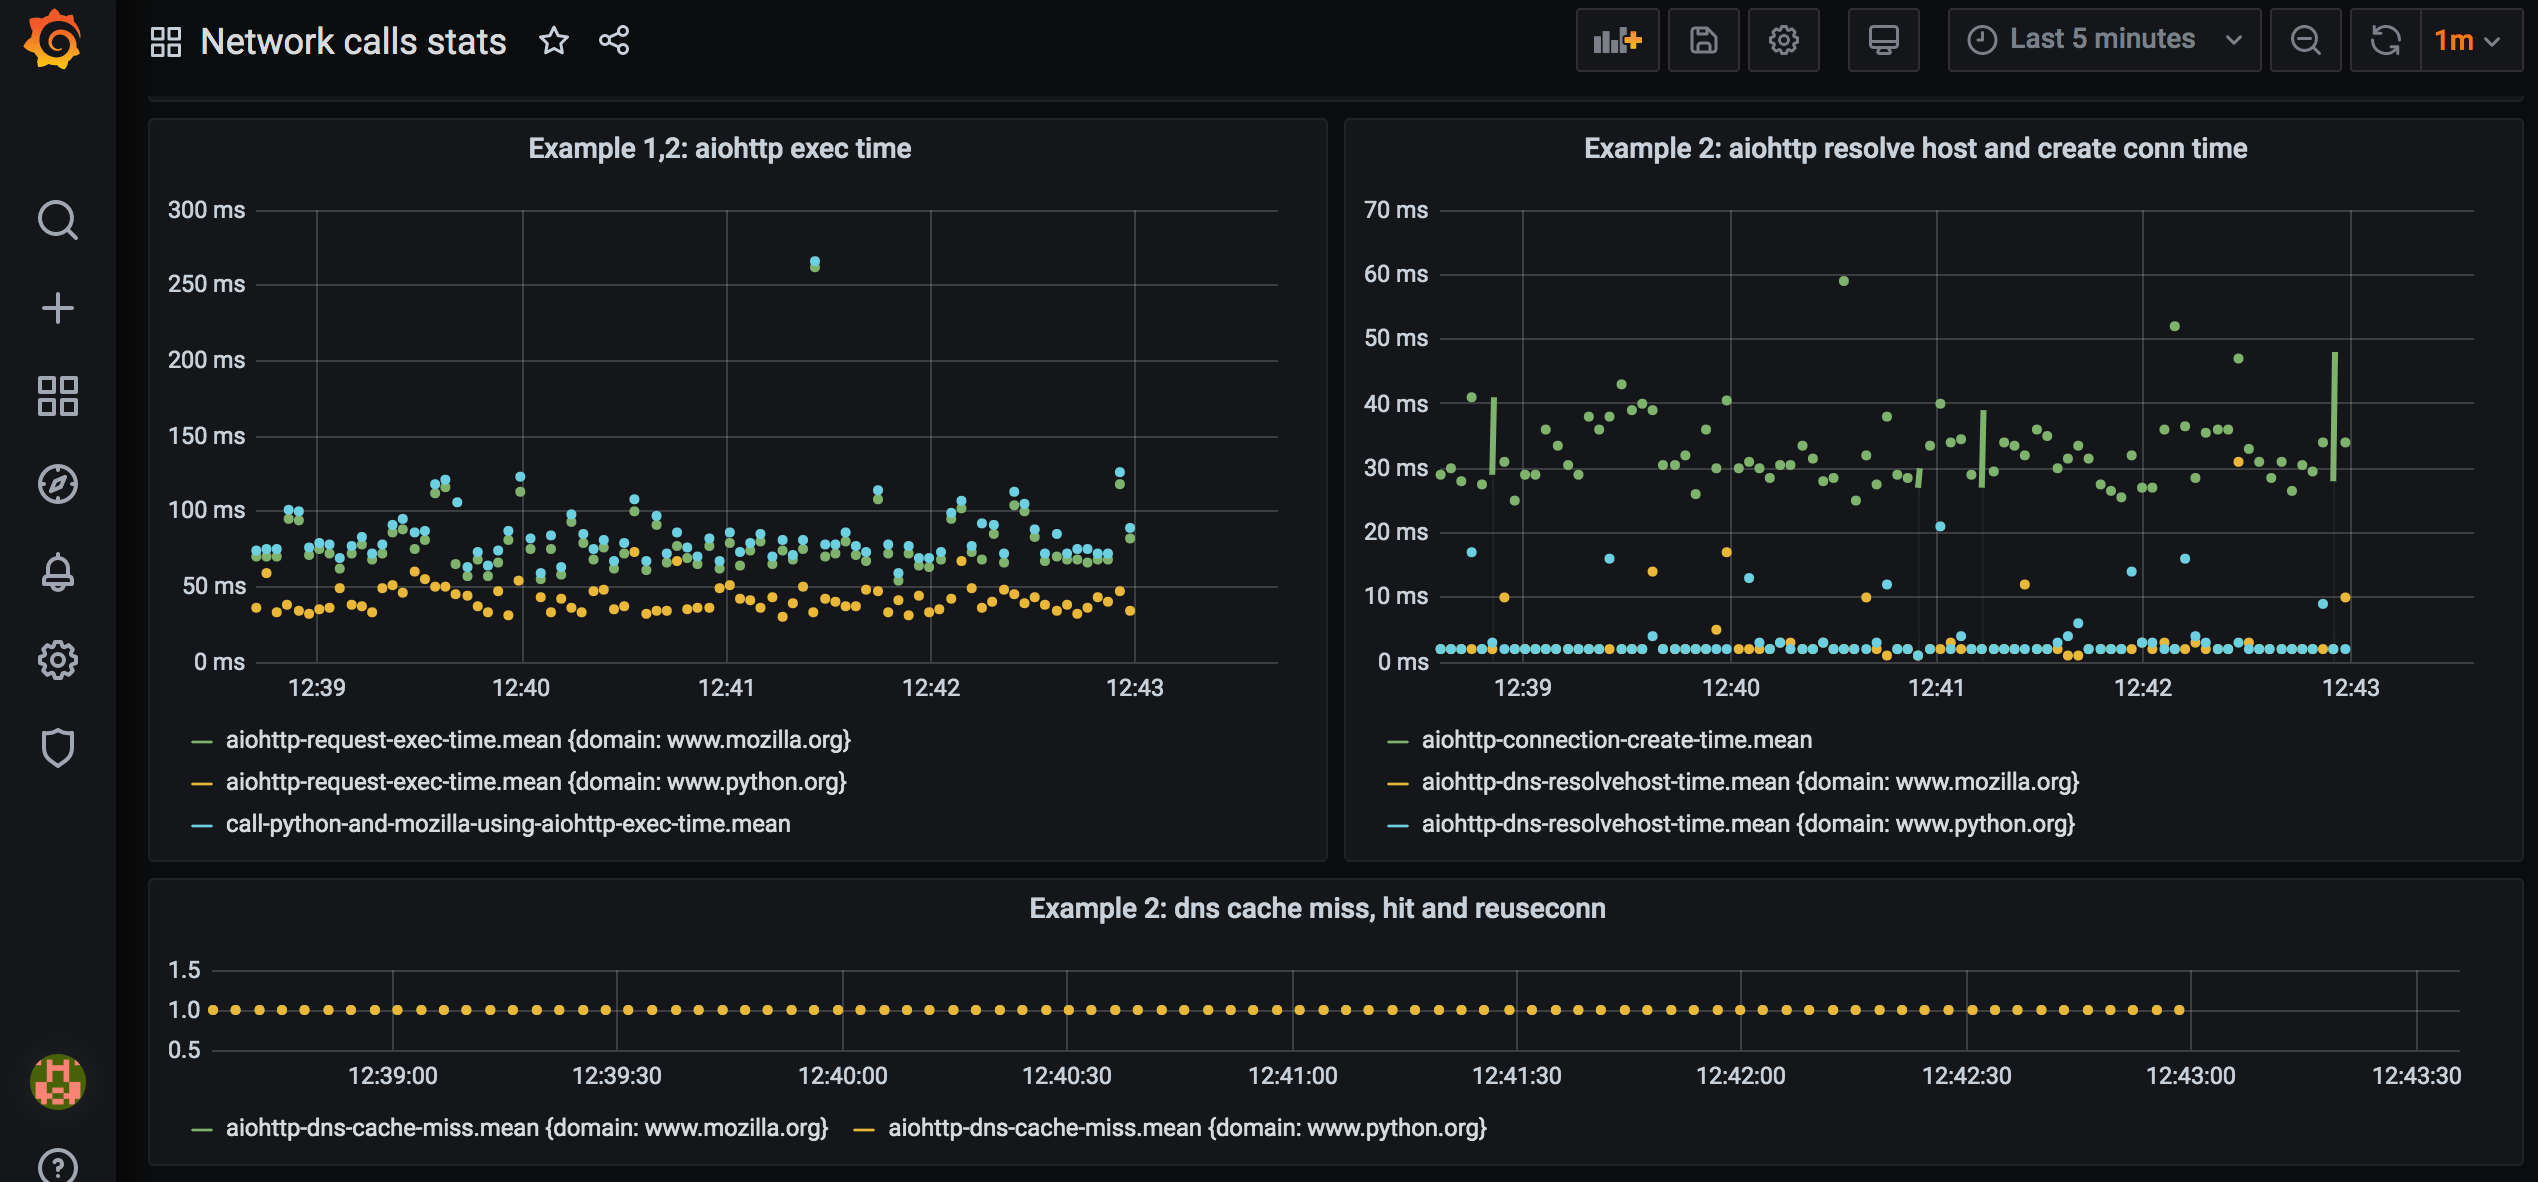
We can see that DNS resolution takes couple of milliseconds and happens for every call, and the connection establishing takes 30-40 msec and happens for every call. Also, that DNS cache is not hit, DNS is resolved for every call.
We can definitely improve on that – in Example 3.
Example 3: aiohttp reuse session
Let’s modify Example 2 code so that ClientSession is created once, outside while loop:
async def main_async():
    async with ClientSession(trace_configs=[Profiler()]) as session:
        while True:
            result = await call_python_and_mozilla_using_aiohttp(session)
            print(result)
            await asyncio.sleep(3)
And check out how stats look now:
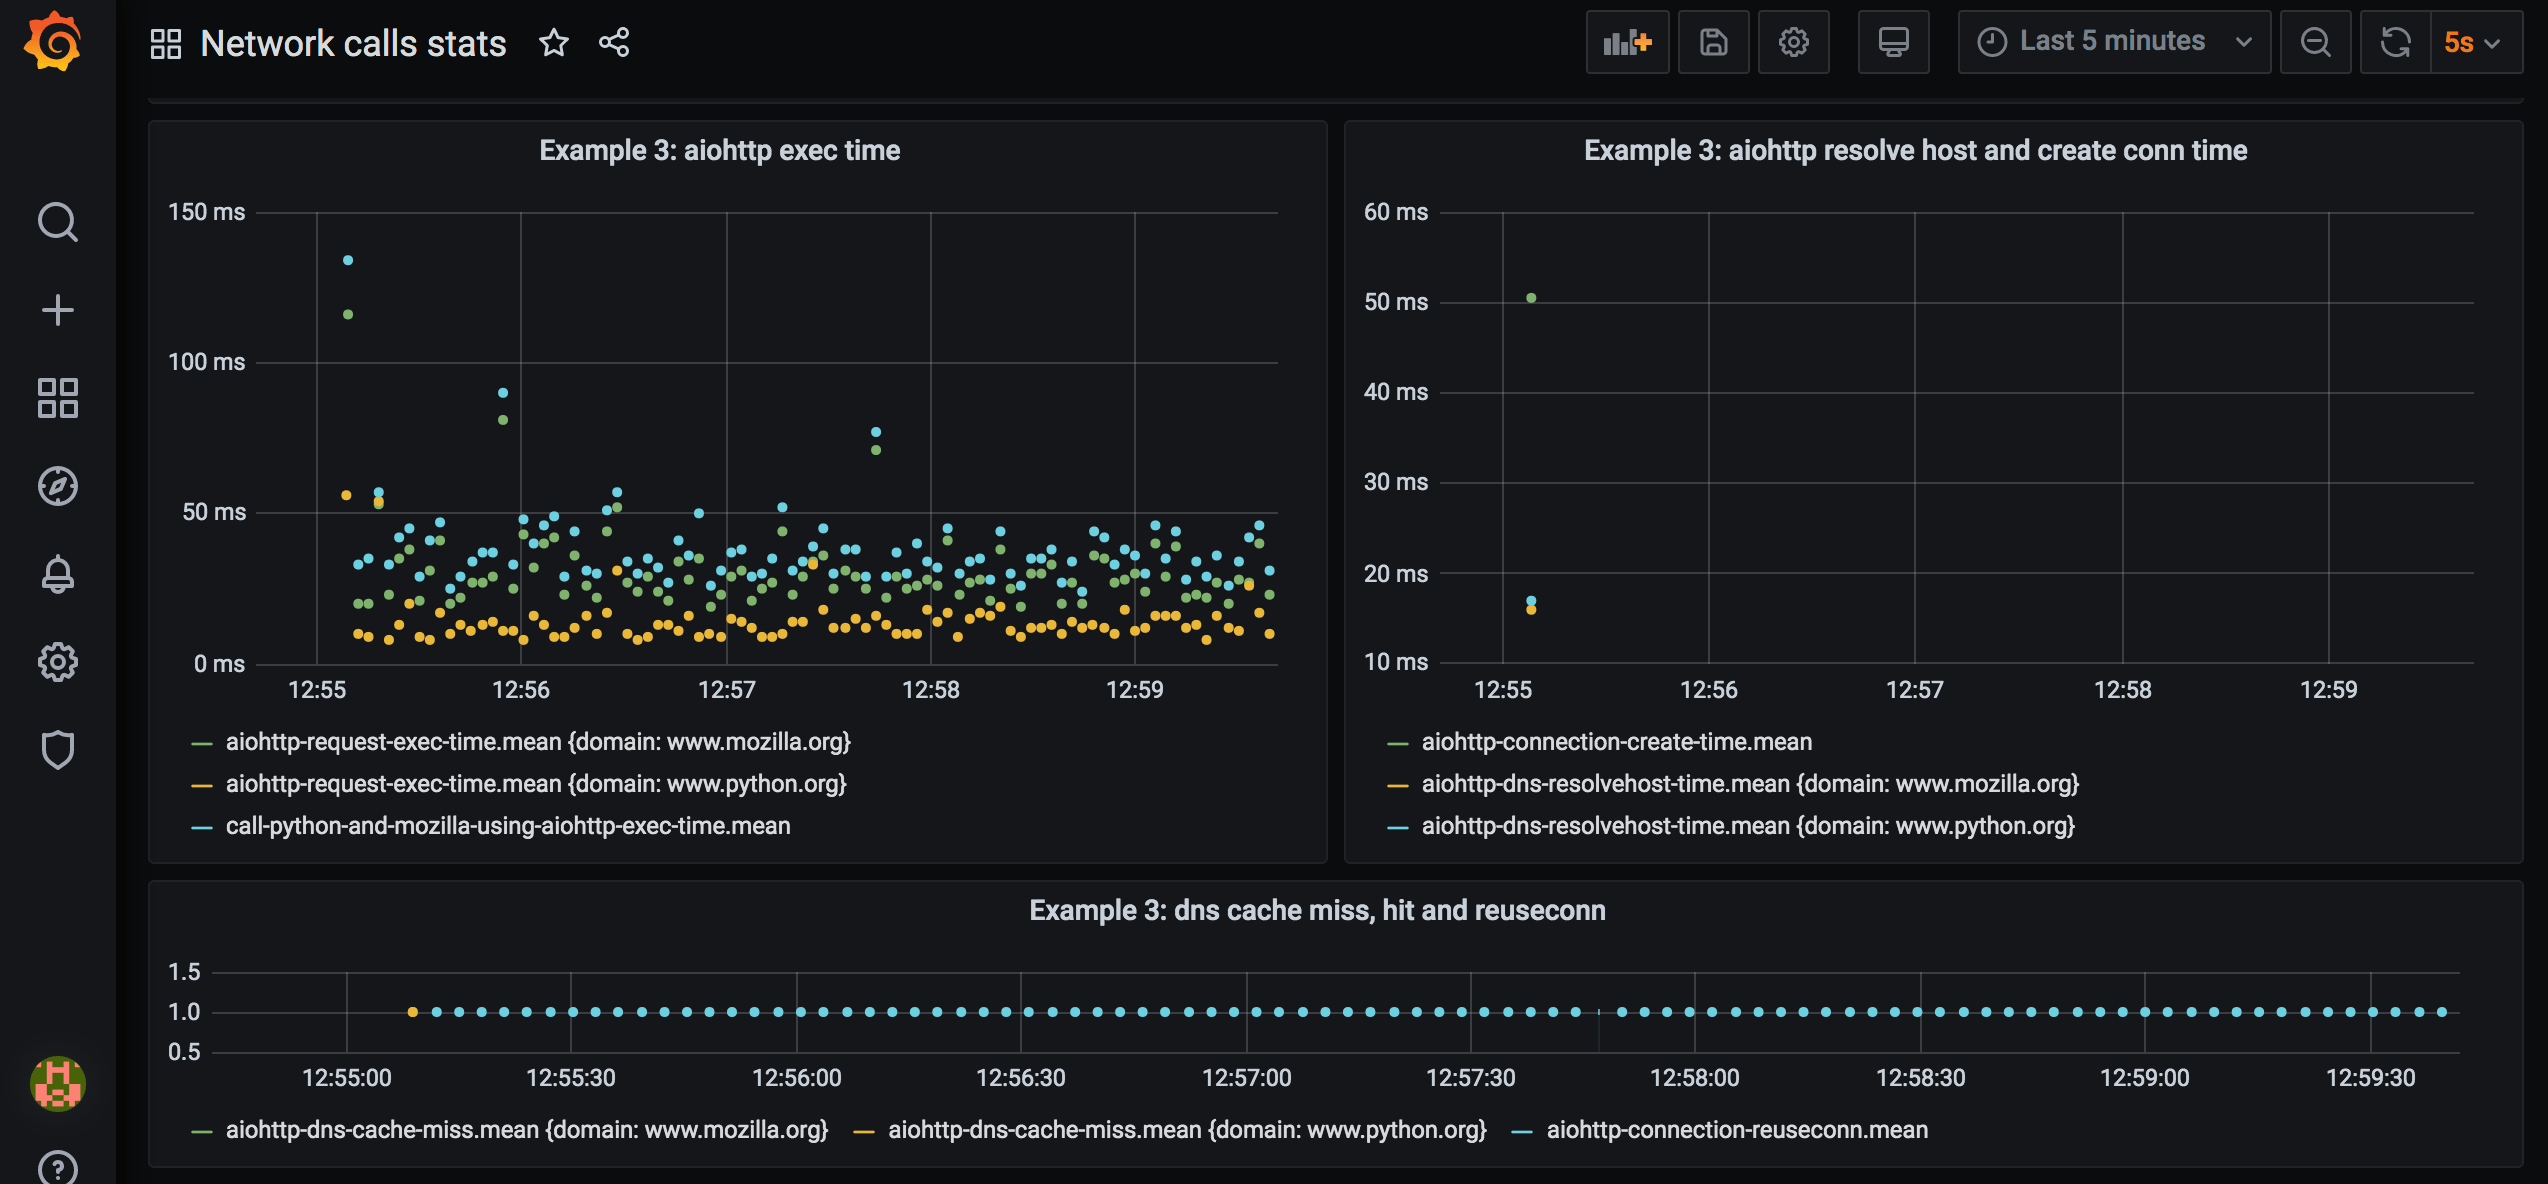
There’s only one dot for connection establishing, and one per DNS resolution per domain. There’s plenty of dots for connection reuse event. Total execution time is below 50 msec. Cool.
Full source code of Example 3 is here.
Compare sync and async URL fetch, with and without reusing connection
Total time for both requests (very approximate):
| Connection not reused | Connection reused | |
|---|---|---|
| Sync | 150 msec | 80 msec |
| Async | 80 msec | 40 msec |
Histogram of request time
Grafana panel can not only plot line graphs, but also:
- show last reading of metric
- show table of metric values
- show bar plots
- show heatmaps (histogram over time)
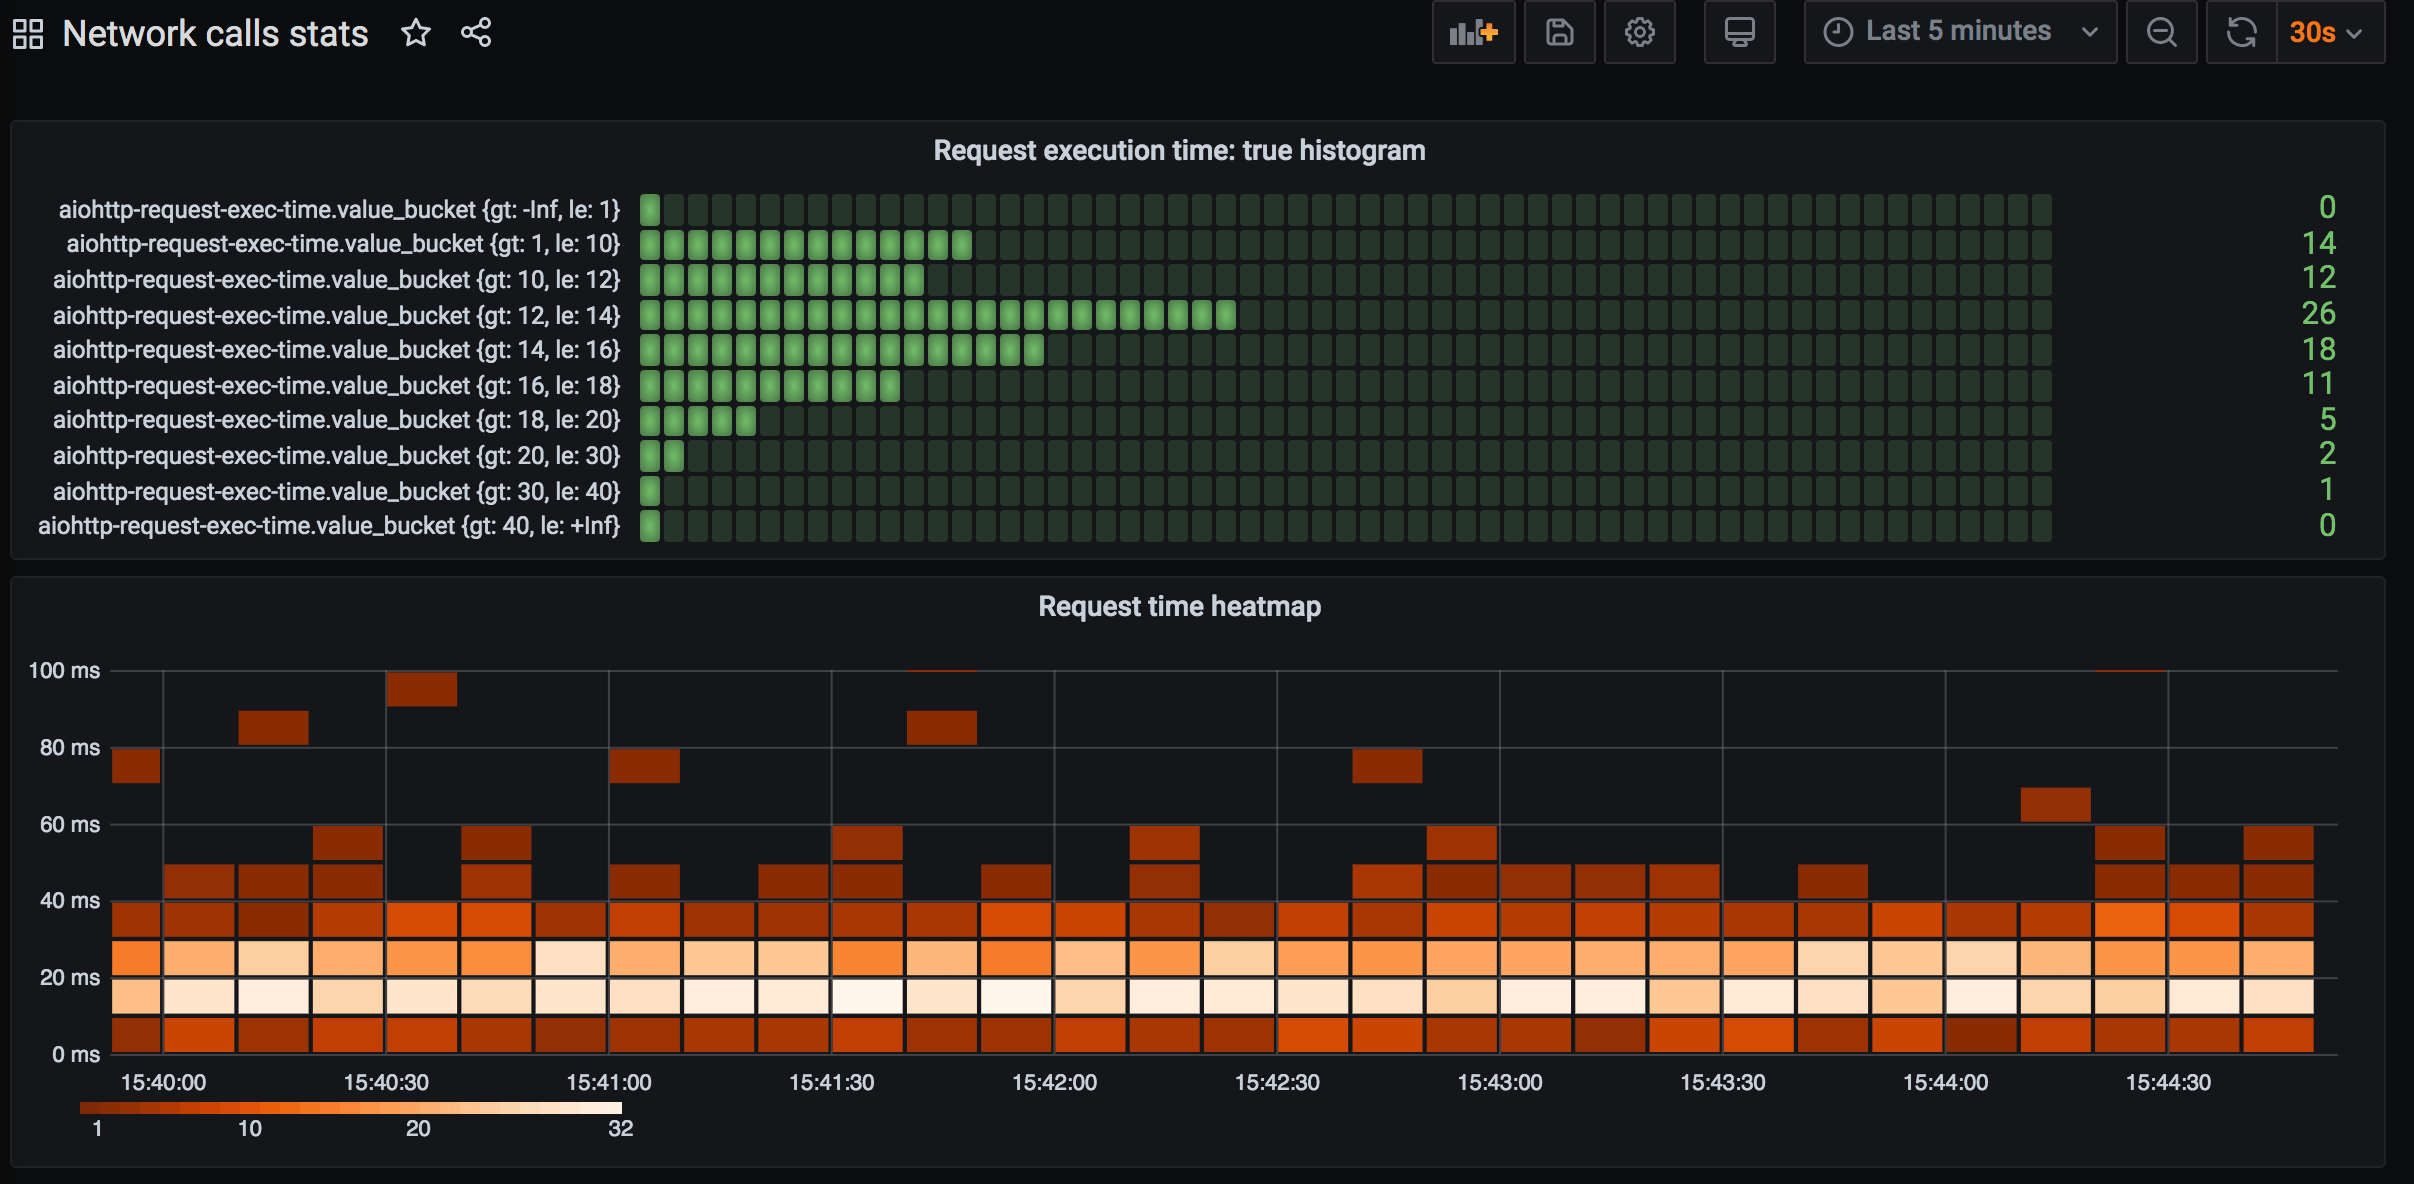
Heatmap is helpful for quickly getting understanding what is distribution of backend response time: it can be the case that most requests complete in under 50 msec, but some requests are slow and complete in >500 msec. Average request time doesn’t show this information. In previous examples, we’re plotting just the average.
We can easily add a heatmap for request execution time: 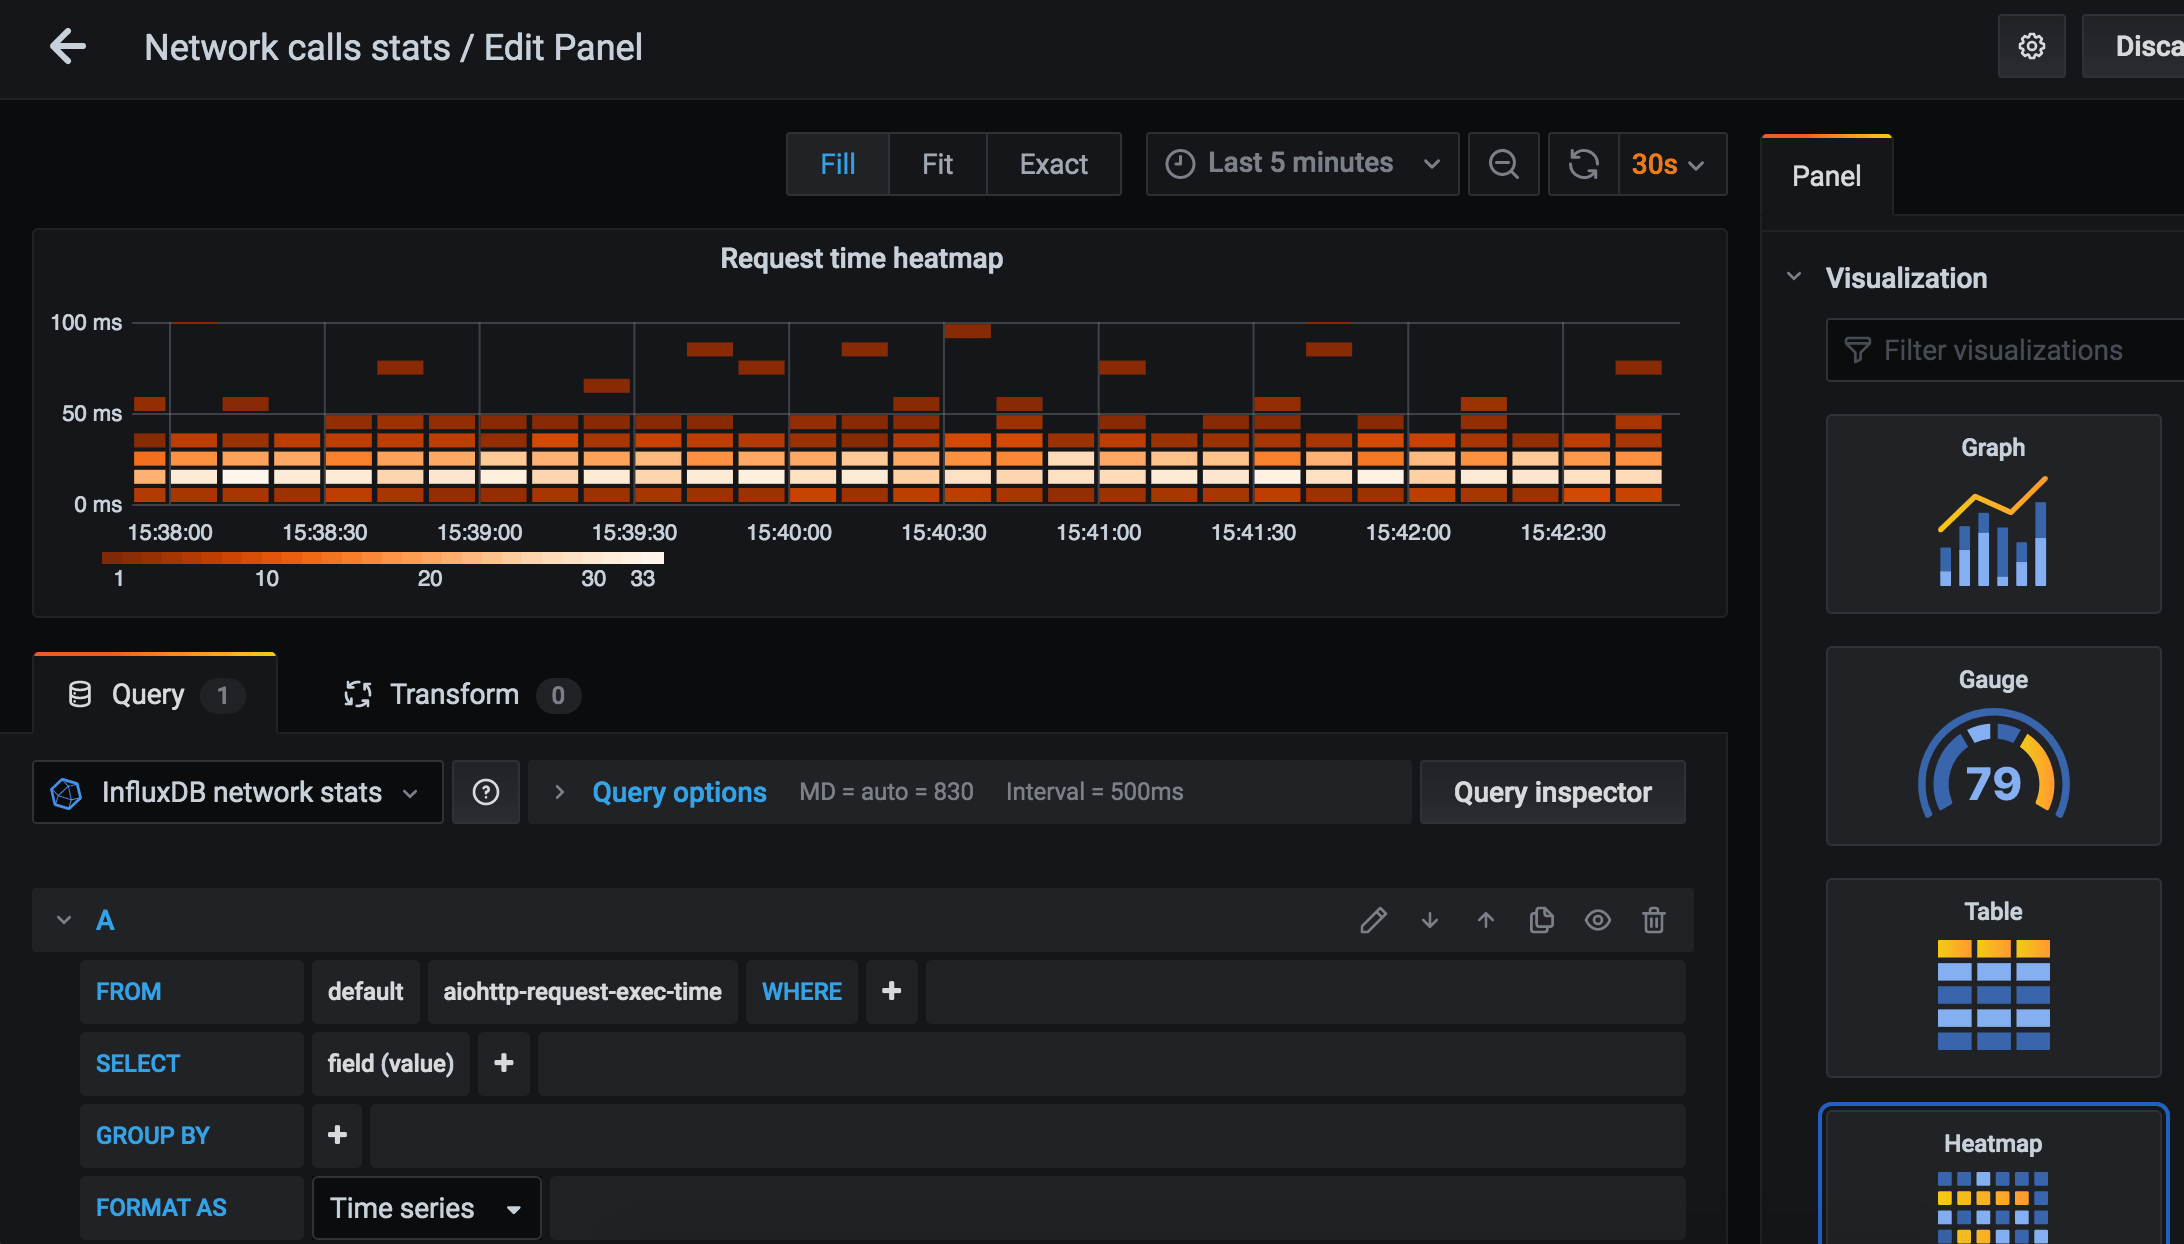
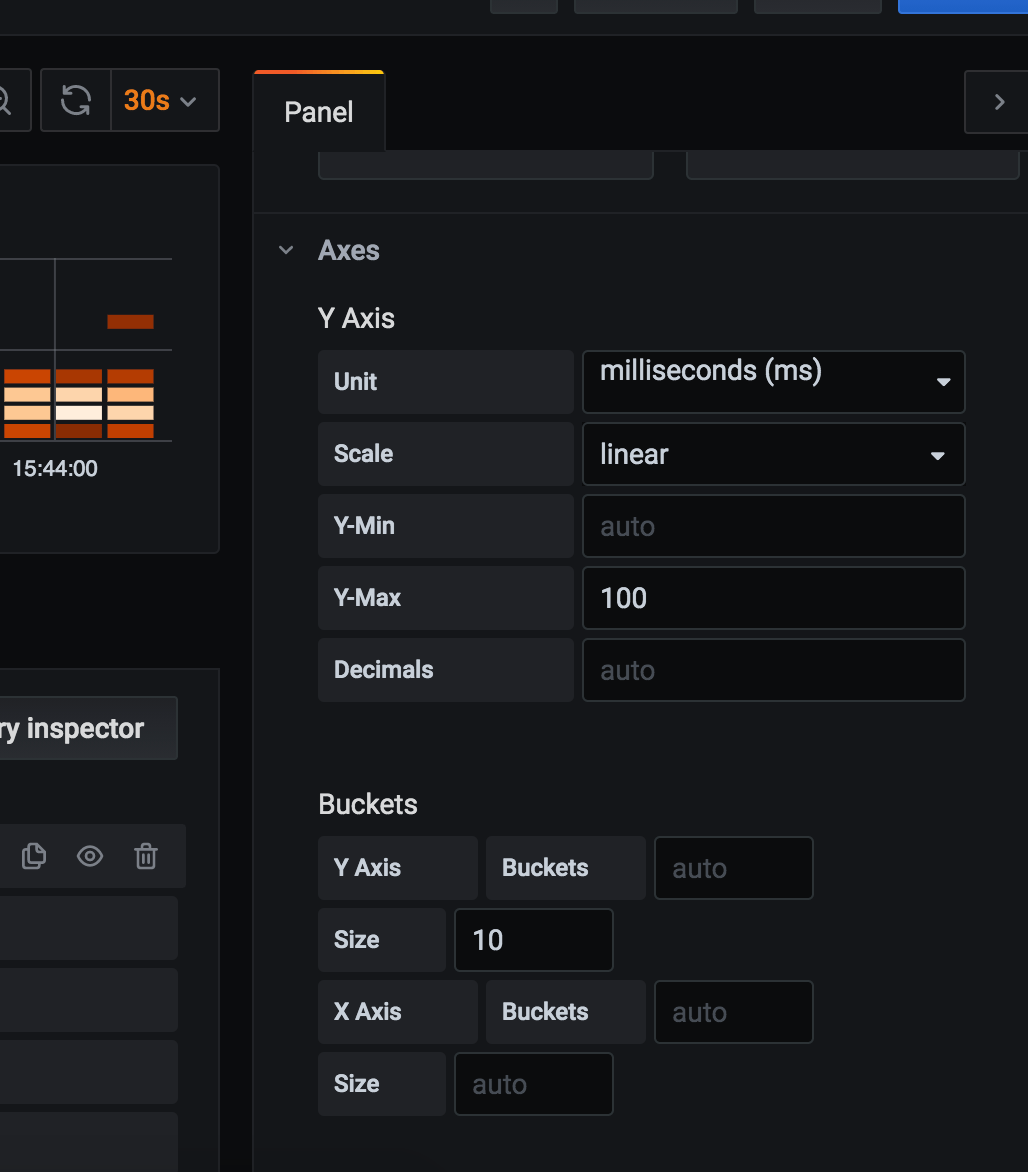
Need to add new panel, pick measurement details, and select “Heatmap” in “Visualization” collapsible in the right column. Every 10 seconds, a new set of bricks appears on the panel. Brick color represents how much measurements fall into that bucket (e.g. 5 fall in the 10 msec – 20 msec range, hence that brick is pink). Set a fixed bucket size or fix the number of buckets, or let default values do their magic.
In case Telegraf sends all metrics data to InfluxDB, that’s a real heatmap. Telegraf is often configured to send only aggregated values to database (min, avg, max) calculated over short period of time (10sec) in order to reduce metrics reporting traffic. Heatmap based on such aggregated value is not a real heatmap.
It is possible to configure histogram aggregate in Telegraf config (full Telegraf config with histogram aggregator):
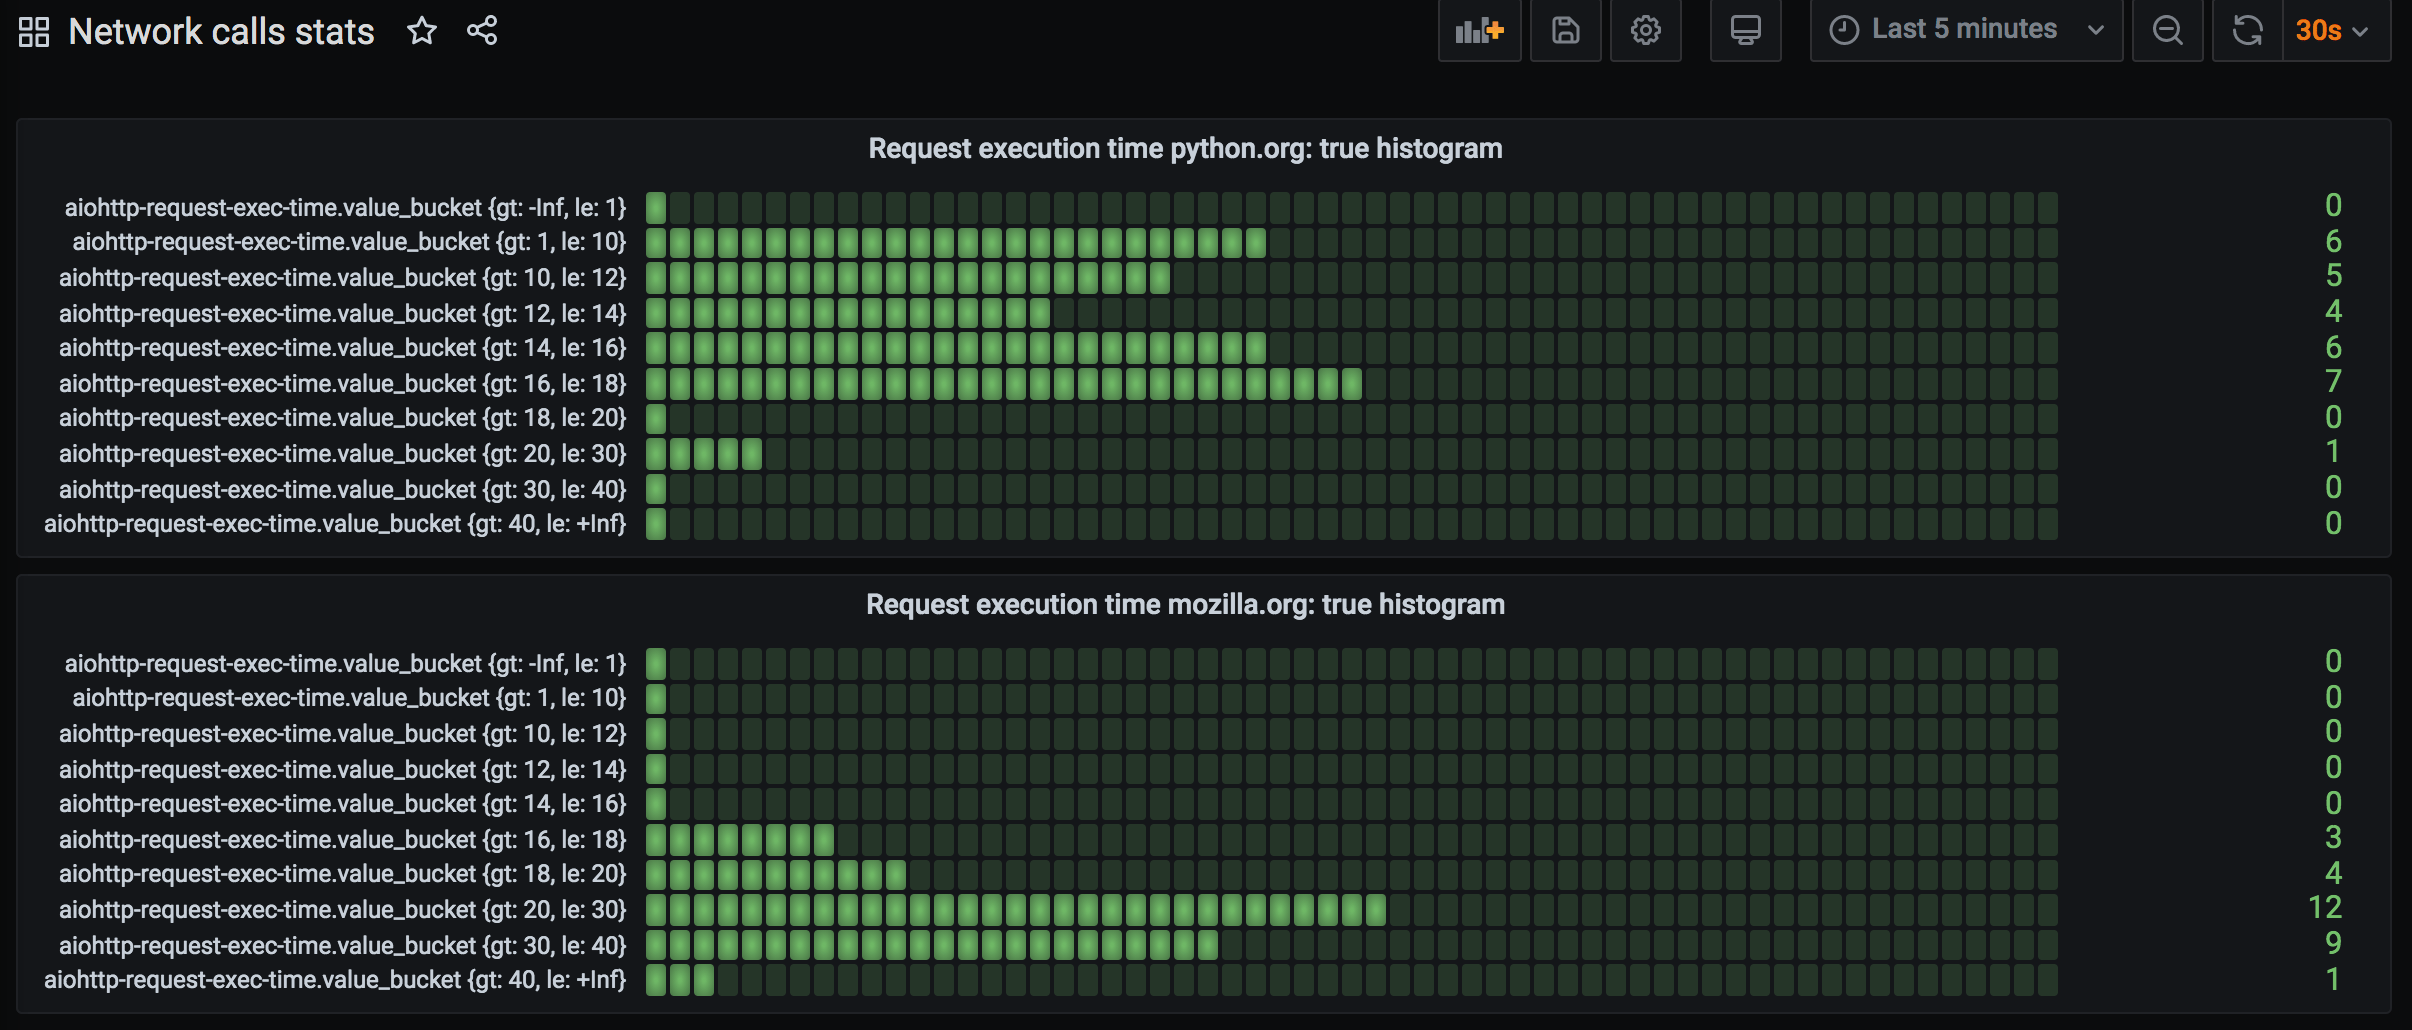
[[aggregators.histogram]]
period = "30s"
drop_original = false
reset = true
cumulative = false

[[aggregators.histogram.config]]
buckets = [1.0, 10.0, 12.0, 14.0, 16.0, 18.0, 20.0, 30.0, 40.0]
measurement_name = "aiohttp-request-exec-time"
fields = ["value"]
I set reset=true and cumulative=false which will cause buckets values to be calculated anew for each 30 second period. Need to set value ranges (buckets) manually, as well as specify correct measurement_name. If fields is not specified, histogram buckets are computed for all fields of measurement. Here’s how bucket values appear in InfluxDB: 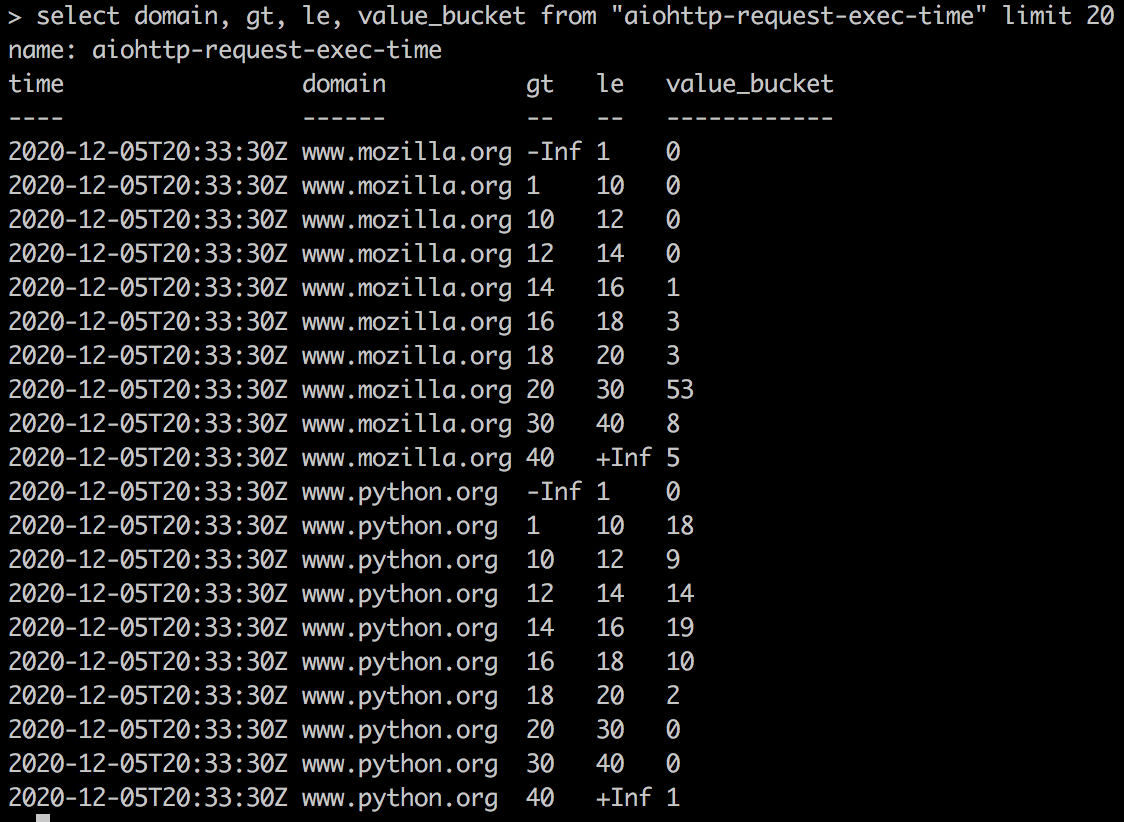
The amount of request execution times that falls in a bucket is saved under “value_bucket” field name, “gt” (“greater than”) and “le” (“less than or equals to”) are bucket edge values that appear as tags.
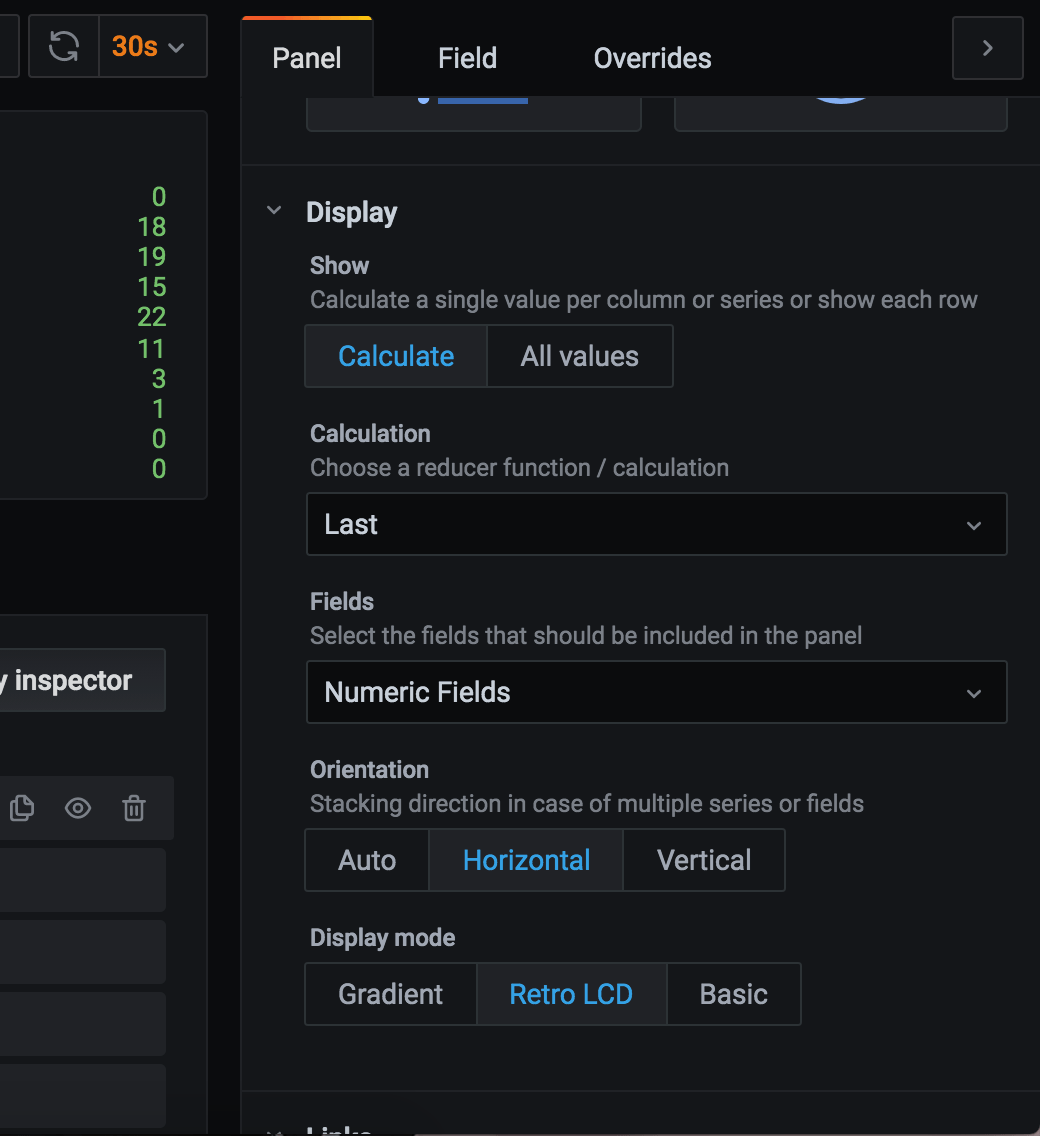
Let’s plot these values using “Bar gauge” panel visualization type:
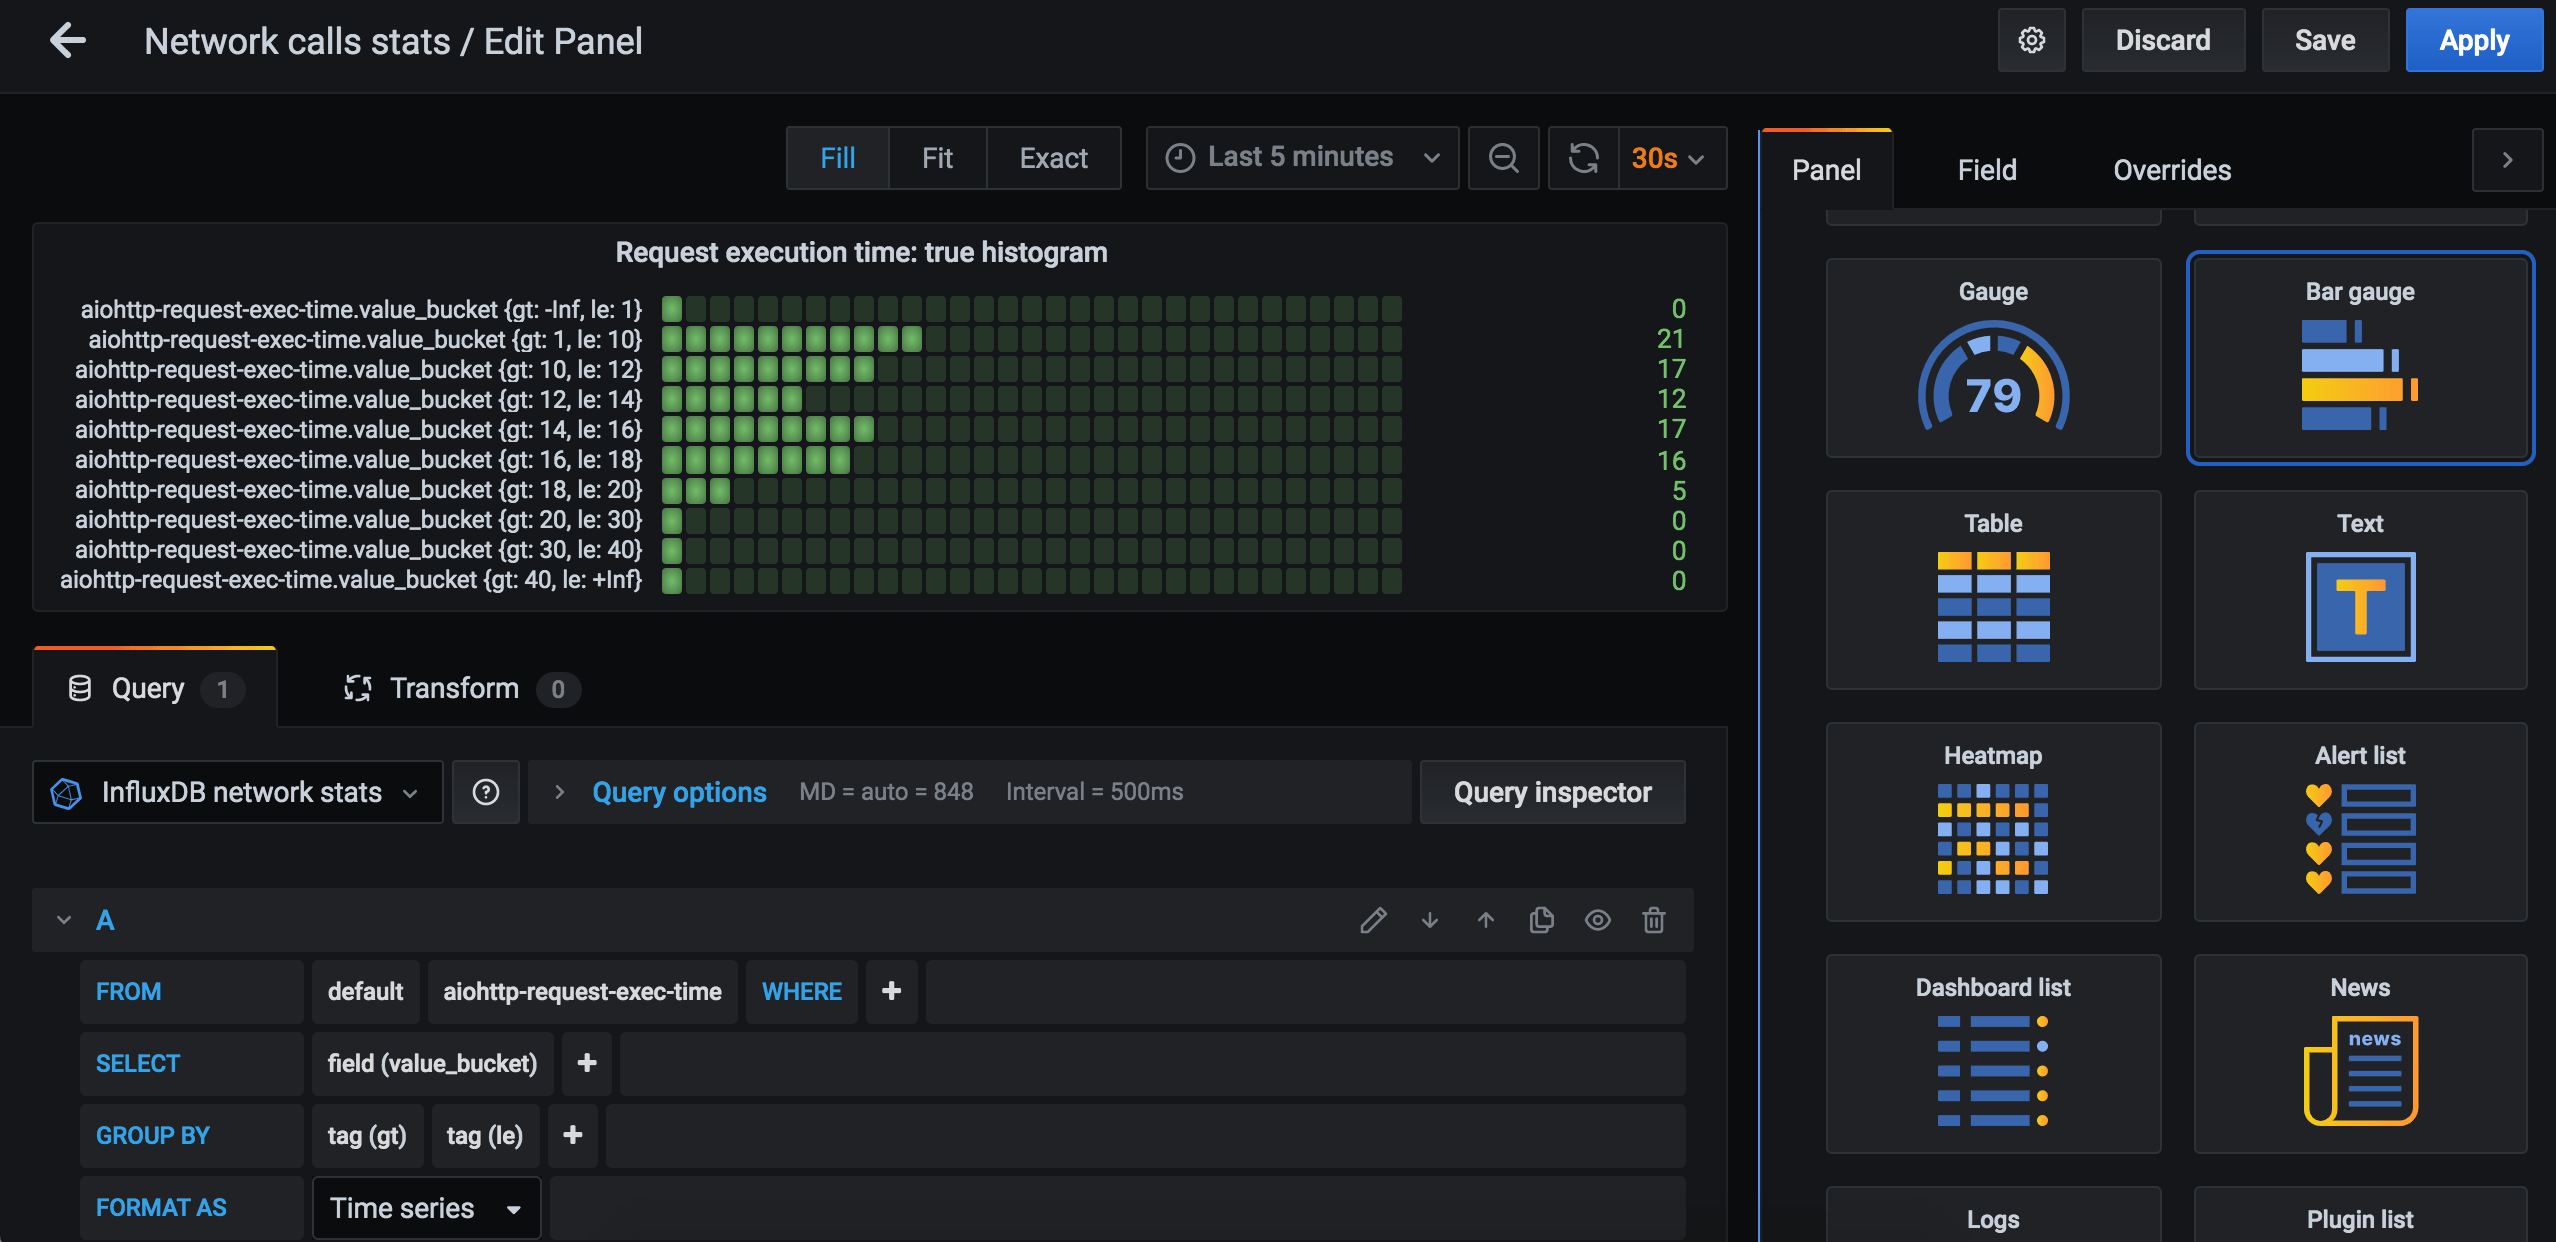
Let’s create 2 separate panels, one for python.org stats and one for mozilla.org (add ‘where domain = python.org’ in query edit).
Now we can at a glance compare last 30 sec request execution time distribution for python.org and for mozilla.org: