

Tobias Baldauf (@tbaldauf) toys with web performance at trivago. He creates innovative web performance tools, new image optimization algorithms and speaks at conferences. He's a proud dad, tries to be a mindful vegetarian and loves making music. Find out more at who.tobias.is
On Cadence, Cohorts and Trained Behavior
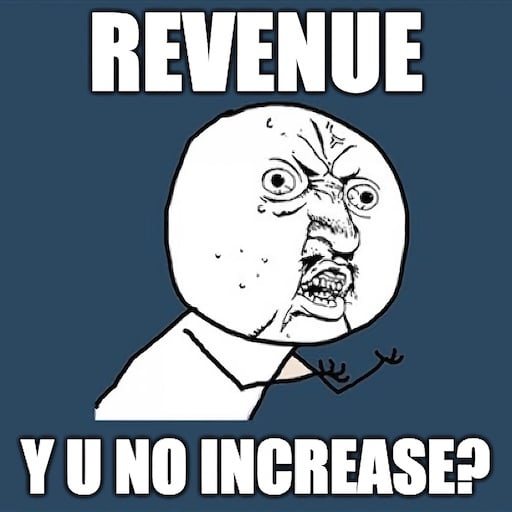
You made a site faster but revenue didn’t improve… was everything those #webperf people told you a lie?
tl;dr: Use traffic frequency as cadence and create cohorts. Effects of improved web performance can show better in a well-defined cohort. Regular users can have trained behavior that resists change.
Don’t panic
Case studies show: improving web performance leads to increased profits. Yet there is little information on test design, traffic composition or timeframe. Should you have fallen for a fantasy of overnight success, don’t panic: look at your data with a focus on cadence, cohorts and trained behavior.
Cadence
Cadence describes the number of cycles taken within a given period of time. You can use this to describe how often users visit your site. Twitter, for example, has a large group of high cadence users who use the site more than once per day. A government tax office website has a majority of very low cadence users who visit once per year to file taxes.
Cohorts
Think about your users’ cadence and create different buckets called “cohorts”. You could define high-, medium- and low cadence cohorts of your users. A more fine-grained split into more cohorts is always possible. Be aware that bot traffic (~40-90%) may skew your cohorts, so remove bot traffic or give it a dedicated bucket.
Now that you have cadence-based cohorts based on your traffic data, ask yourself: “Which cohort is most likely to show a change in behavior because of this improvement?”. High-cadence users might be the first to react differently. Or only cold browser-cache, no DNS-resolved users querying data that neither GraphQL nor Varnish have in memory will show an effect. Comparing only freshly onboarded users’ behavior is also a valid option.
Testing Gotchas
How you expose your users to the faster site is crucial. Doing a 100% traffic before/after test may taint results due to Seasonality effects. If you use a third-party client-side A/B testing solution, the manufacturer may make changes to the tool and influence the test. DNS-based comparative testing is also unreliable. Invest in CDN edge-computed multivariate testing to circumvent many such potential issues.
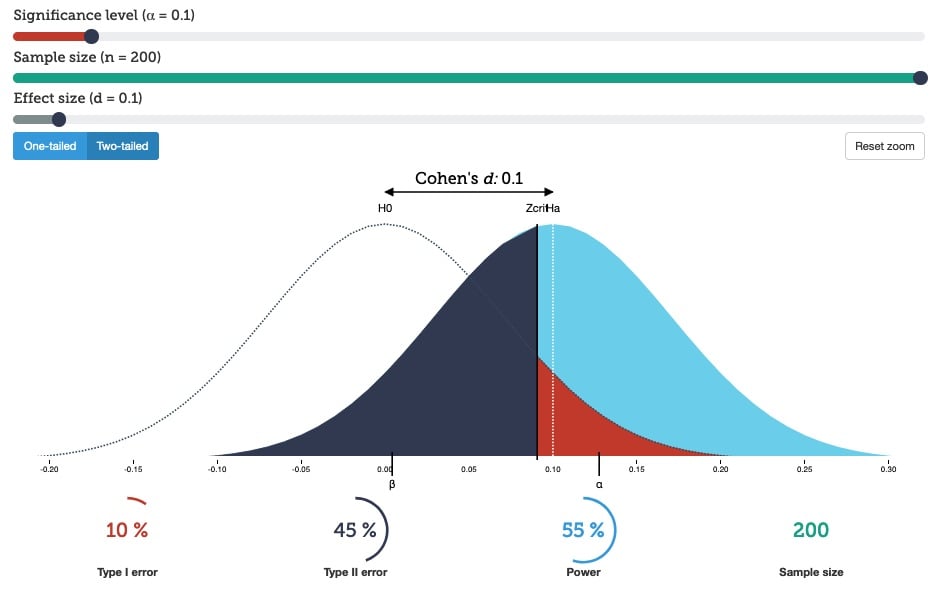
When doing multivariate testing, calculate the necessary p-value to gain statistical significance. If you have an almost-fixed user base, but test on a cohort of only new users, data gathering will take a long time which increases side effects.

Check the KPIs that you expect to change. Case studies preach better conversion rates, but pages per session, gallery interactions or onboarding more new users are also good metrics. Make sure that your selected metrics improve for the right reasons. Increased newsletter signups through the site’s footer form element can be the consequence of lower CLS (Yay!) or because stuff is breaking on certain browsers/devices/networks so that only header and footer elements are visible (Boo! And also: true story!).
Trained Behavior
The approaches above may help you to refine your test setup and quantify the impact of improved web performance. But users’ trained behavior can still ruin the test. If you make an element faster that used to be slow and users know it to be slow, their behavior might not change.

Think of an image gallery that users interact with on their journey. Images in the unoptimized gallery are slow and interface animations jerky. Its metric of images viewed per user session is low. The new, optimized gallery loads well-compressed images faster and the interface is snappy. So you select “increase in images viewed per user-session” as a success-metric.
Sadly, real world data proves you wrong. The reason: trained behavior. Users know the image gallery to be slow so that they open it, look only at the preloaded images and close it again without engaging any further. It is difficult to gather data on improved interactions that users have learned to avoid.
Get Out
Proving that you haven’t made business KPIs worse can be easier and faster than proving a win. Use technical metrics such as improved render times, better Time To First Meaningful Interaction or battery savings to qualify the improvement. If you or your colleagues have experience with user research, run a user behavior research lab session comparing experiences & interactions of the slow vs. the fast site.
Summary
It can be frustrating to put in the hard work to improve web performance and then not see an immediate impact on business KPIs. Grouping user traffic into cohorts, e.g. by usage frequency expressed in cadence, can bring to light the user segment that shows a significant effect. Be mindful of interaction patterns and resulting trained behavior that your users have. Check your test setup so that you’re actually comparing the proverbial apples to apples.