

Tsvetan Stoychev (@ceckoslab) is a Web Performance enthusiast, creator of the open source Real User Monitoring tool Basic RUM, street artist and a Senior Software Engineer at Akamai.
Rich Raposa (@richraposa) is the Director of Global Learning at ClickHouse, Inc. His goal is to educate and enable IT professionals who need to understand and use ClickHouse effectively.
The aim of this article is to provide a quick introduction to ClickHouse for the Web Performance community. The article talks about some interesting Core Web Vitals queries and points to where we can find help about ClickHouse.
During the past few years I was searching for a database that suits my hobby project Basic RUM. What I needed was an OLAP (Online analytical processing) database. It wasn’t just about finding a database that does the job but I also needed a database that is easy to work with, has great documentation and an amazing community. ClickHouse is the first OLAP database I have used and it ticks all the boxes. Also I don’t claim that ClickHouse is the best database for RUM data analyses, but I find it convenient for my use case because I always find support and answers to my questions from the ClickHouse community.
Very quickly I was able to install ClickHouse locally and start experimenting with it. What helped me learn and experiment quickly was the great community and the fact that there is a Grafana datasource plugin for ClickHouse. The Grafana integration enabled me to run experiments with various queries I found on the Internet and observe the results in Grafana dashboards.
How I discovered ClickHouse?
Whenever I start investigating a new technology, I like to check out if there are any good YouTube videos. Checking out my YouTube history I can see that I started watching ClickHouse videos on January 4th, 2021, and I watched 4 videos in a row for nearly two hours. I was instantly hooked!
So follow my lead, and check out the first 2 videos I watched about ClickHouse and become a cult member:
- “How Fast is ClickHouse-Fast?” by Robert Hodges
- “ClickHouse Introduction” by Alexey Milovidov
But what is ClickHouse?
ClickHouse is a really, really fast columnar database, especially for analytical queries and analyses over time series. It’s open source and it has a great community. It has great documentation and it is really easy to try it out locally using Docker. ClickHouse talks SQL … well, a dialect of SQL.
Today ClickHouse is widely used for various use cases but some of the popular ones are:
- Yandex Metrica – ClickHouse is the database engine behind the Russian Google Analytics.
- ByteDance – used as a component of the inhouse machine learning of ByteDance – the company beyond TikTok.
- The documentation also has a long list of success stories of companies using ClickHouse
Here is how ClickHouse developed over the years:
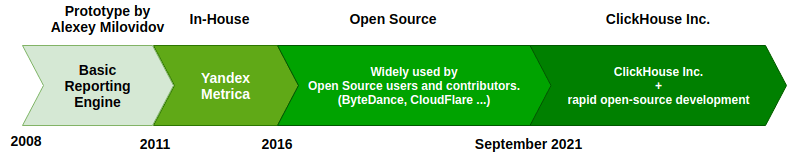
In September of 2021, ClickHouse, Inc. was funded and incorporated to rapidly accelerate open-source product development and, in parallel, deliver a best in class serverless multi-tenant cloud offering.
Why is ClickHouse blazing fast?
According to Rich Raposa, the Director of Global Learning at ClickHouse:
“You always hear how columnar storage is what makes ClickHouse fast, and that really is a key feature. When you insert a set of rows, a file is created for each column. The data in that column file is compressed in blocks and contains only the sorted values of the column (except for the occasional checksum), so there is little wasted space. When you query your data, ClickHouse uses a clever sparse index file, along with a file of marks, to quickly find subsets of those blocks (referred to as granules) that could possibly be a part of the result set.
“Aside from minimising the amount of disk I/O, this granular approach has another performance benefit – granules get processed in parallel. Adding more cores to your system will speed up the processing of large queries. ClickHouse leverages all available CPU cores and disks on all the machines in your cluster.
“And even those design decisions are only a part of what makes ClickHouse fast: vectorized query execution, in-memory dictionaries, choosing the best hash functions and sorting algorithms – it all plays a role in making ClickHouse as fast as it can be.”
What is a good schema for such a database?
After some trial and error I found that for my use case the most convenient type of database schema is Star Schema, and this is what I realised other ClickHouse folks are using.
In short, a Star Schema consists of a large table called a fact table that contains mostly metrics data of events (in terms of web performance the events would be page visits) and dimension tables that have foreign keys in the large table. For example, dimension tables could contain information about a country, marketing campaign, etc. This article explains the basics: Data Warehousing Guide – Core Concepts.
In reality most of the analytical SELECT queries will be targeting the fact table.
This is how Star Schema looks like visually:
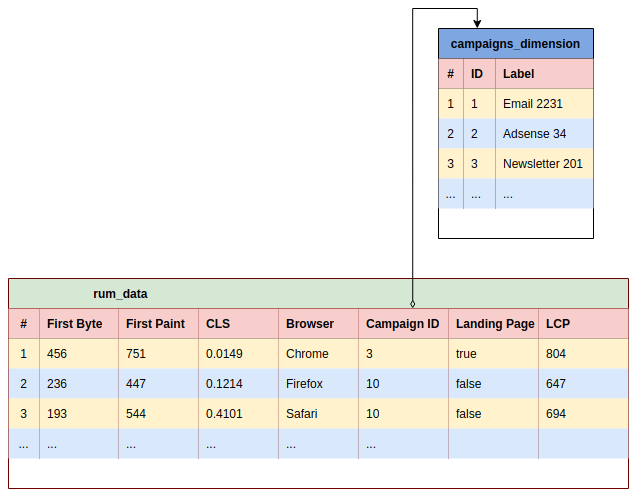
rum_data– a fact tablecampaigns_dimension– a dimension table
Let’s get practical
Let’s suppose that we already installed ClickHouse and persisted data in the rum_data fact table.
Here is an example of the structure and values in the fact table, where for simplicity we do not display any dimension tables.
| # | lcp | cls | fid | session_ length |
url | country | device |
|---|---|---|---|---|---|---|---|
| 1 | 804 | 0.0149 | 42 | 1 | www.example.com/de | DE | mobile |
| 2 | 647 | 0.1214 | 35 | 4 | www.example.com/us/about-us | US | desktop |
| 3 | 394 | 0.4101 | 67 | 3 | www.example.com/fr/programme | FR | mobile |
| … | … | … | … | … | … |
Let’s look at some queries that I use regularly to analyse web performance.
Core Web Vitals
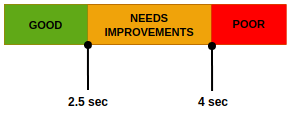
Largest Contentful Paint (LCP) distribution
For Core Web Vitals we look at LCP in 3 buckets:
The following SQL (written in ClickHouse dialect) does all the necessary calculations:
SELECT count() as all_lcp,
  ((countIf(lcp, lcp <= 2500) / all_lcp) * 100) as good_lcp,
  ((countIf(lcp, lcp > 2500 AND lcp <= 4000) / all_lcp) * 100) as needs_improvements_lcp,
  ((countIf(lcp, lcp > 4000) / all_lcp) * 100) as poor_lcp

FROM rum_data
WHERE lcp IS NOT NULL
      AND browser_name = 'Chrome'
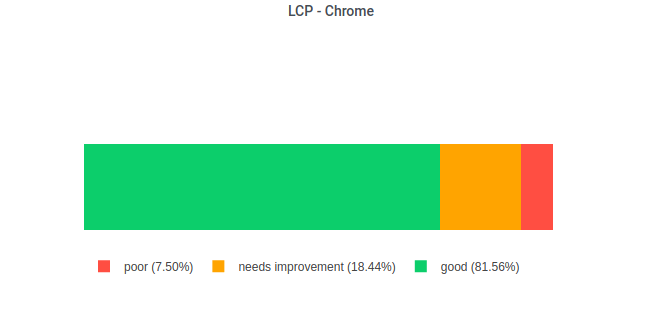
An example how the result of the query looks like:
| all_lcp | poor_lcp | needs_improvements_lcp | good_lcp |
|---|---|---|---|
| 30749 | 7.50 | 18.4 | 81.6 |
With the help of Plotly we can visualise data in the same fashion it’s visualised today in PageSpeed Insights:
First Input Delay (FID) distribution
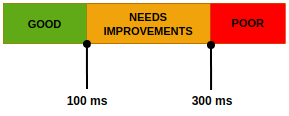
Core Web Vitals looks at FID in the following 3 buckets:
The following SQL (written in ClickHouse dialect) does all the necessary calculations:
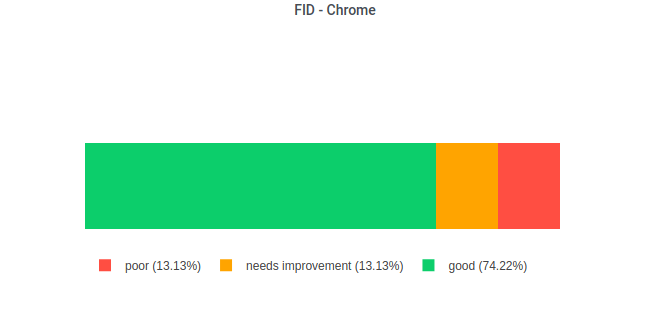
SELECT count() as all_fid,
  ((countIf(fid, fid <= 100) / all_fid) * 100) as good_fid,
  ((countIf(fid, fid > 100 AND fid <= 300) / all_fid) * 100) as needs_improvements_fid,
  ((countIf(fid, fid > 300) / all_fid) * 100) as poor_fid

FROM rum_data
WHERE browser_name = 'Chrome'
An example how the result of the query looks like:
| all_fid | poor_fid | needs_improvements_fid | good_fid |
|---|---|---|---|
| 73216 | 12.6 | 13.1 | 74.2 |
With the help of Plotly we can visualise the FID distribution in the same fashion it’s visualised today in PageSpeed Insights:
Cumulative Layout Shift (CLS)
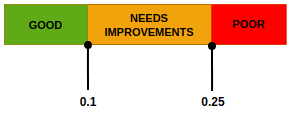
Core Web Vitals looks at CLS in the following 3 buckets:
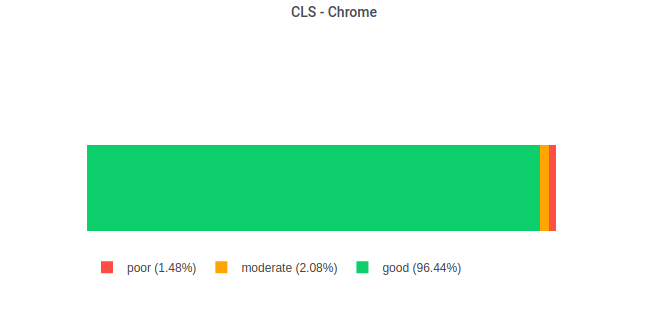
The following SQL (written in ClickHouse dialect) does all the necessary calculations:
SELECT count() as all_cls,
  ((countIf(cls, cls > 0.25) / all_cls) * 100) as poor_cls,
  ((countIf(cls, cls > 0.1 AND cls <= 0.25) / all_cls) * 100) as needs_improvements_cls,
  ((countIf(cls, cls <= 0.1) / all_cls) * 100) as good_cls

FROM rum_data
WHERE cls IS NOT NULL
      AND browser_name = 'Chrome'
An example how the result of the query looks like:
| all_cls | poor_cls | needs_improvements_cls | good_cls |
|---|---|---|---|
| 458767 | 1.48 | 2.08 | 96.4 |
With the help of Plotly we can visualise the CLS distribution in the same fashion it’s visualised today in PageSpeed Insights:
LowCardinality Data Type
If you look closer in the Core Web Vitals queries you will notice that in the WHERE clause we use browser_name = 'Chrome' but not something like browser_id = 3 . It’s reasonable to ask why we don’t use a foreign key that references a dimension table browser_names.
Thanks to the LowCardinality data type in some special cases we can break some of the usual conventions and avoid using dimension tables. According to the official documentation we will get a performance benefit if we store less than 10,000 distinct values in a LowCardinality column.
Here is the official documentation about the LowCardinality data type: https://clickhouse.com/docs/en/sql-reference/data-types/lowcardinality/
Most frequent values / TopK
ClickHouse has a built-in function that calculates the most frequent values in the specified column: https://clickhouse.com/docs/en/sql-reference/aggregate-functions/reference/topk/
The most popular pages example
SELECT arrayJoin(topK(5)(url)) AS url
FROM rum_data
Example result:
| url |
|---|
| https://www.example.com/ |
| https://www.example.com/clothes |
| https://www.example.com/femme/1304d-the-brighter-the-bolder.html |
| https://www.example.com/product/1 |
| https://www.example.com/en-ce-moment/nouvel-an.html |
The most popular landing pages example
SELECT arrayJoin(topK(5)(url)) AS url
FROM rum_data
WHERE session_length = 1
Example result:
| url |
|---|
| https://www.example.com/ |
| https://www.example.com/returns |
| https://www.example.com/about |
| https://www.example.com/payment-methods |
| https://www.example.com/en-ce-moment.html |
Where to find help?
The ClickHouse – Slack channel
Link: https://join.slack.com/t/clickhousedb/shared_invite/zt-rxm3rdrk-lIUmhLC3V8WTaL0TGxsOmg
Here you can interact directly with the ClickHouse community. In case of a question, the community is often very responsive and provides helpful direction. Some of the active community members are the Altininty team, ClickHouse developers and other folks that use ClickHouse in production.
Altinity resources
Altinity – Altinity provides support as well as managed ClickHouse in AWS and GCP. They have a popular blog with many ClickHouse-related articles as well as a Youtube channel with videos, including some cited in this article.
YouTube channel – Tutorials, webinars and meetups recordings: https://www.youtube.com/c/AltinityLtd/videos
Blog posts: https://altinity.com/blog/
Webinars: https://altinity.com/webinarspage/
ClickHouse resources
YouTube channel – Webinars, meetups and conference talks recordings: https://www.youtube.com/c/ClickHouseDB/videos
The official ClickHouse learning resources: https://clickhouse.com/learn/
Acknowledgements
- Barry Pollard – Barry contributed with proofreading, grammar corrections and suggestions about how CWV are calculated.
- Rich Raposa – Rich contributed by authoring the section “Why is ClickHouse blazing fast?”. He also helped with grammar corrections.
- Robert Hodges – Couple of months ago in ClickHouse Slack discussion Robert helped me to craft the SQL queries that calculate the CWV buckets.