

Hongbo Song (@HongboSong) is a software engineer at Google Chrome Speed metrics team. Currently he works on Core Web Vitals development.
Background
In 2020, Google launched the Web Vitals metrics, which included a responsiveness metric: First Input Delay. But First Input Delay is not perfect. It only measures a portion of the latency users feel for the first user input. To capture more latency and measure more user inputs, our team (Chrome Speed Metrics) is experimenting with ideas for new responsiveness metrics which are more comprehensive than First Input Delay. This post shows how to measure the interaction latencies from our new responsiveness metrics and break them down for your own web page via the Event Timing API. And it is intended to be a hands-on demo with the new metrics. If you’re reading it and having difficulty understanding what interactions are, please read our earlier blog post which goes into more details.
Measure Interaction Latency
In the new responsiveness metrics, we measure the latency of user interactions, how your customers navigate and act on your website, rather than individual events. A user interaction, such as tap (click), drag, and keyboard interaction, usually triggers multiple events. For example, a keyboard interaction consists of a key press and subsequent release. When a user presses a key, the browser fires a keydown event. After the user releases the key, a keyup event will be fired. We plan to capture every associated event’s duration, from initial user input until the next visual update occurs on the page after all the event handlers have run. We define the interaction latency to be the maximum duration of any event triggered by the interaction.
To calculate the interaction latency, we need to use the interactionId which was added to the Event Timing API in Chrome 96. An interactionId represents a unique user interaction. Events triggered by an interaction share the same interactionId.
Try it out in the devtools console
The code snippet below shows how to calculate interaction latency in devtools console using JavaScript. To try out the code, you’ll need Chrome version 97.0.4692.36 or higher, which is in beta as of this writing. In Chrome 96 and below, a bug can result in incorrect numbers.
const interactionMap = new Map();
new PerformanceObserver((entries) => {
 for (const entry of entries.getEntries()) {
   // Ignore entries without an interaction ID.
   if (entry.interactionId > 0) {
     // Get the interaction for this entry, or create one if it doesn't exist.
     let interaction = interactionMap.get(entry.interactionId);
     if (!interaction) {
       interaction = {latency: 0, entries: []};
       interactionMap.set(entry.interactionId, interaction);
     }
     interaction.entries.push(entry);
     interaction.latency = Math.max(entry.duration, interaction.latency);
     // Output the interactionId and the interaction latency.
     console.log(entry.name,
       'Event duration:', entry.duration, '\n',
       'interactionId:', entry.interactionId, '\n',
       'Interaction latency:', interaction.latency);
 }
}
}).observe({type: 'event', buffered: true, durationThreshold: 16});
If we tap on a real web page and run the code, we could get an output such as:

Here we just produced a tap interaction. It has a start (finger taps down), which triggers a pointerdown event, and an end (we release the finger), which triggers a pointer event and a click event. You may notice these three events have the same interactionId (5304), which means they were triggered by the same user interaction. And we take the maximum event duration as the latency of the tap from all events fired due to the interaction (in this case, pointerdown, pointerup and click), which is the pointerup event with a latency of 64.
So what exactly contributes to the latency of the tap? Let’s use the EventTiming API to get more detailed information. The following code (we omitted helper functions code) will break down the latencies of the interaction and associated events.
const interactionMap = new Map();
new PerformanceObserver((entries) => {
  let newInteractions = [];
  for (const entry of entries.getEntries()) {
    // Ignore entries without an interaction ID.
    if (entry.interactionId > 0) {
      // Get the interaction for this entry, or create one if it doesn't exist.
      const interactionType = getInteractionType(entry.name);
      const interactionId = entry.interactionId + ' - ' + interactionType;
      let interaction = interactionMap.get(interactionId);
      if (!interaction) {
        interaction = {
            latency: entry.duration,
            delay: entry.processingStart - entry.startTime,
            target: entry.target,
            processingTimes: {}        };
        interactionMap.set(interactionId, interaction);
        newInteractions.push(interactionId);
      }
      if (interactionType) {
        interaction.type = interactionType;
      }
      entryDelay = entry.processingStart - entry.startTime;
      if (entryDelay < interaction.delay) {
        interaction.delay = entryDelay;
      }
      interaction.processingTimes[entry.name] = entry.processingEnd - entry.processingStart;
      interaction.processingTime = Object.values(interaction.processingTimes).reduce((a, b) => a + b);
      if (entry.duration > interaction.latency) {
        interaction.latency = entry.duration;
      }
    }
  }
  for (const newInteraction of newInteractions) {
    logInteraction(interactionMap.get(newInteraction));
  }
}).observe({type: 'event', buffered: true, durationThreshold: 16});

// Helper function code
...
As you can see in the purple boxes in the diagram below, an event has a delay which is the time between when the user started the interaction or the event was created and when the browser was able to process it (this is the same “delay” in First Input Delay). In the EventTiming API, you can calculate the delay by subtracting entry.startTime from entry.processingStart.
The event also has a processing time, which is the time it took to run all the event handlers for an event. In the EventTiming API, you can compute the processing time by subtracting entry.processingStart from entry.processingEnd.
And finally, there is usually a paint as a result of an event. In the EventTiming API, the entry.duration _which represents the event duration includes this time. Here we call entry.duration – processing time – delay _the time to next paint.

Remember that an interaction contains more than one event. For example, in the diagram above, the start of a tap includes a pointerdown event and the end of the tap includes a pointerup event and a click event. So if we want to break this down, we need to use the interactionId to link these events together, and combine information in order to correctly compute the interaction’s delay, processing time, and time to next paint. If you take the full code snippet and paste it into the JavaScript console, you can see this breakdown for each interaction. Here’s the breakdown for the previous tap:
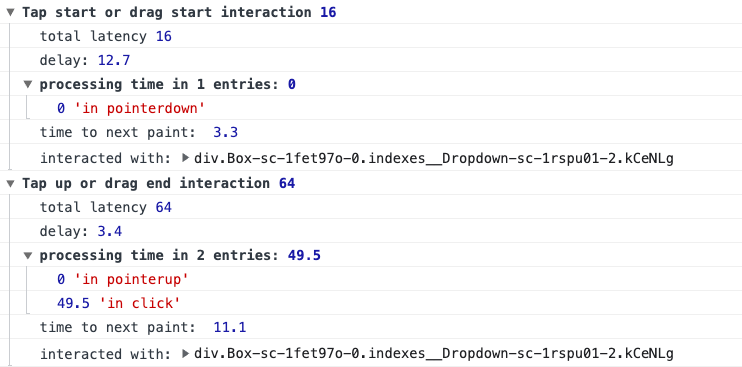
The latency of the tap is 64ms. You’ll notice the code splits the interaction into two parts: the tap start is 16ms and includes the pointerdown event handler. The tap up is 64 ms and includes both the pointerup and click events. You can see from the breakdown that most of the time is spent in the click handler in this example. You can use event listener breakpoints to dig further into what code is running during the click event.
If you see that delay is taking up most of the time, you’ll want to dig into minimizing work on the main thread that is blocking event handlers from running.
And if you see a large time to next paint, check into the complexity of the DOM changes you are making.
Go ahead and try it out yourself! Paste the above code in the JavaScript console in Chrome 97 or higher, and interact with any page. Tap, click, drag, and type. The interaction breakdowns will show up in the console, and you can see how responsive your page is to user input.
Try it out in Lighthouse
It’s helpful to be able to poke at interaction times in the devtools console. But you can also automate measuring interactions with the new Lighthouse user flows! Brendan Kenny has authored an experimental Lighthouse plugin to simulate user interactions and measure the responsiveness of a web page in the lab.
Why automate this? In some cases, there can be numerous user interactions on a page. By using Lighthouse, you are able to simulate as many user interactions as you need and get a high level idea of how any set of interactions on your page might score. Automating the interactions also makes them easier to reproduce reliably. Imagine you have a specific interaction and you have to ensure it doesn’t regress. Or you want to run 3 dozen times to check how the numbers of your page shake out overall. You can use lighthouse user flows to pull all the numbers automatically!
Lighthouse report
We tested the Lighthouse plugin on a real world website and got the report as below:
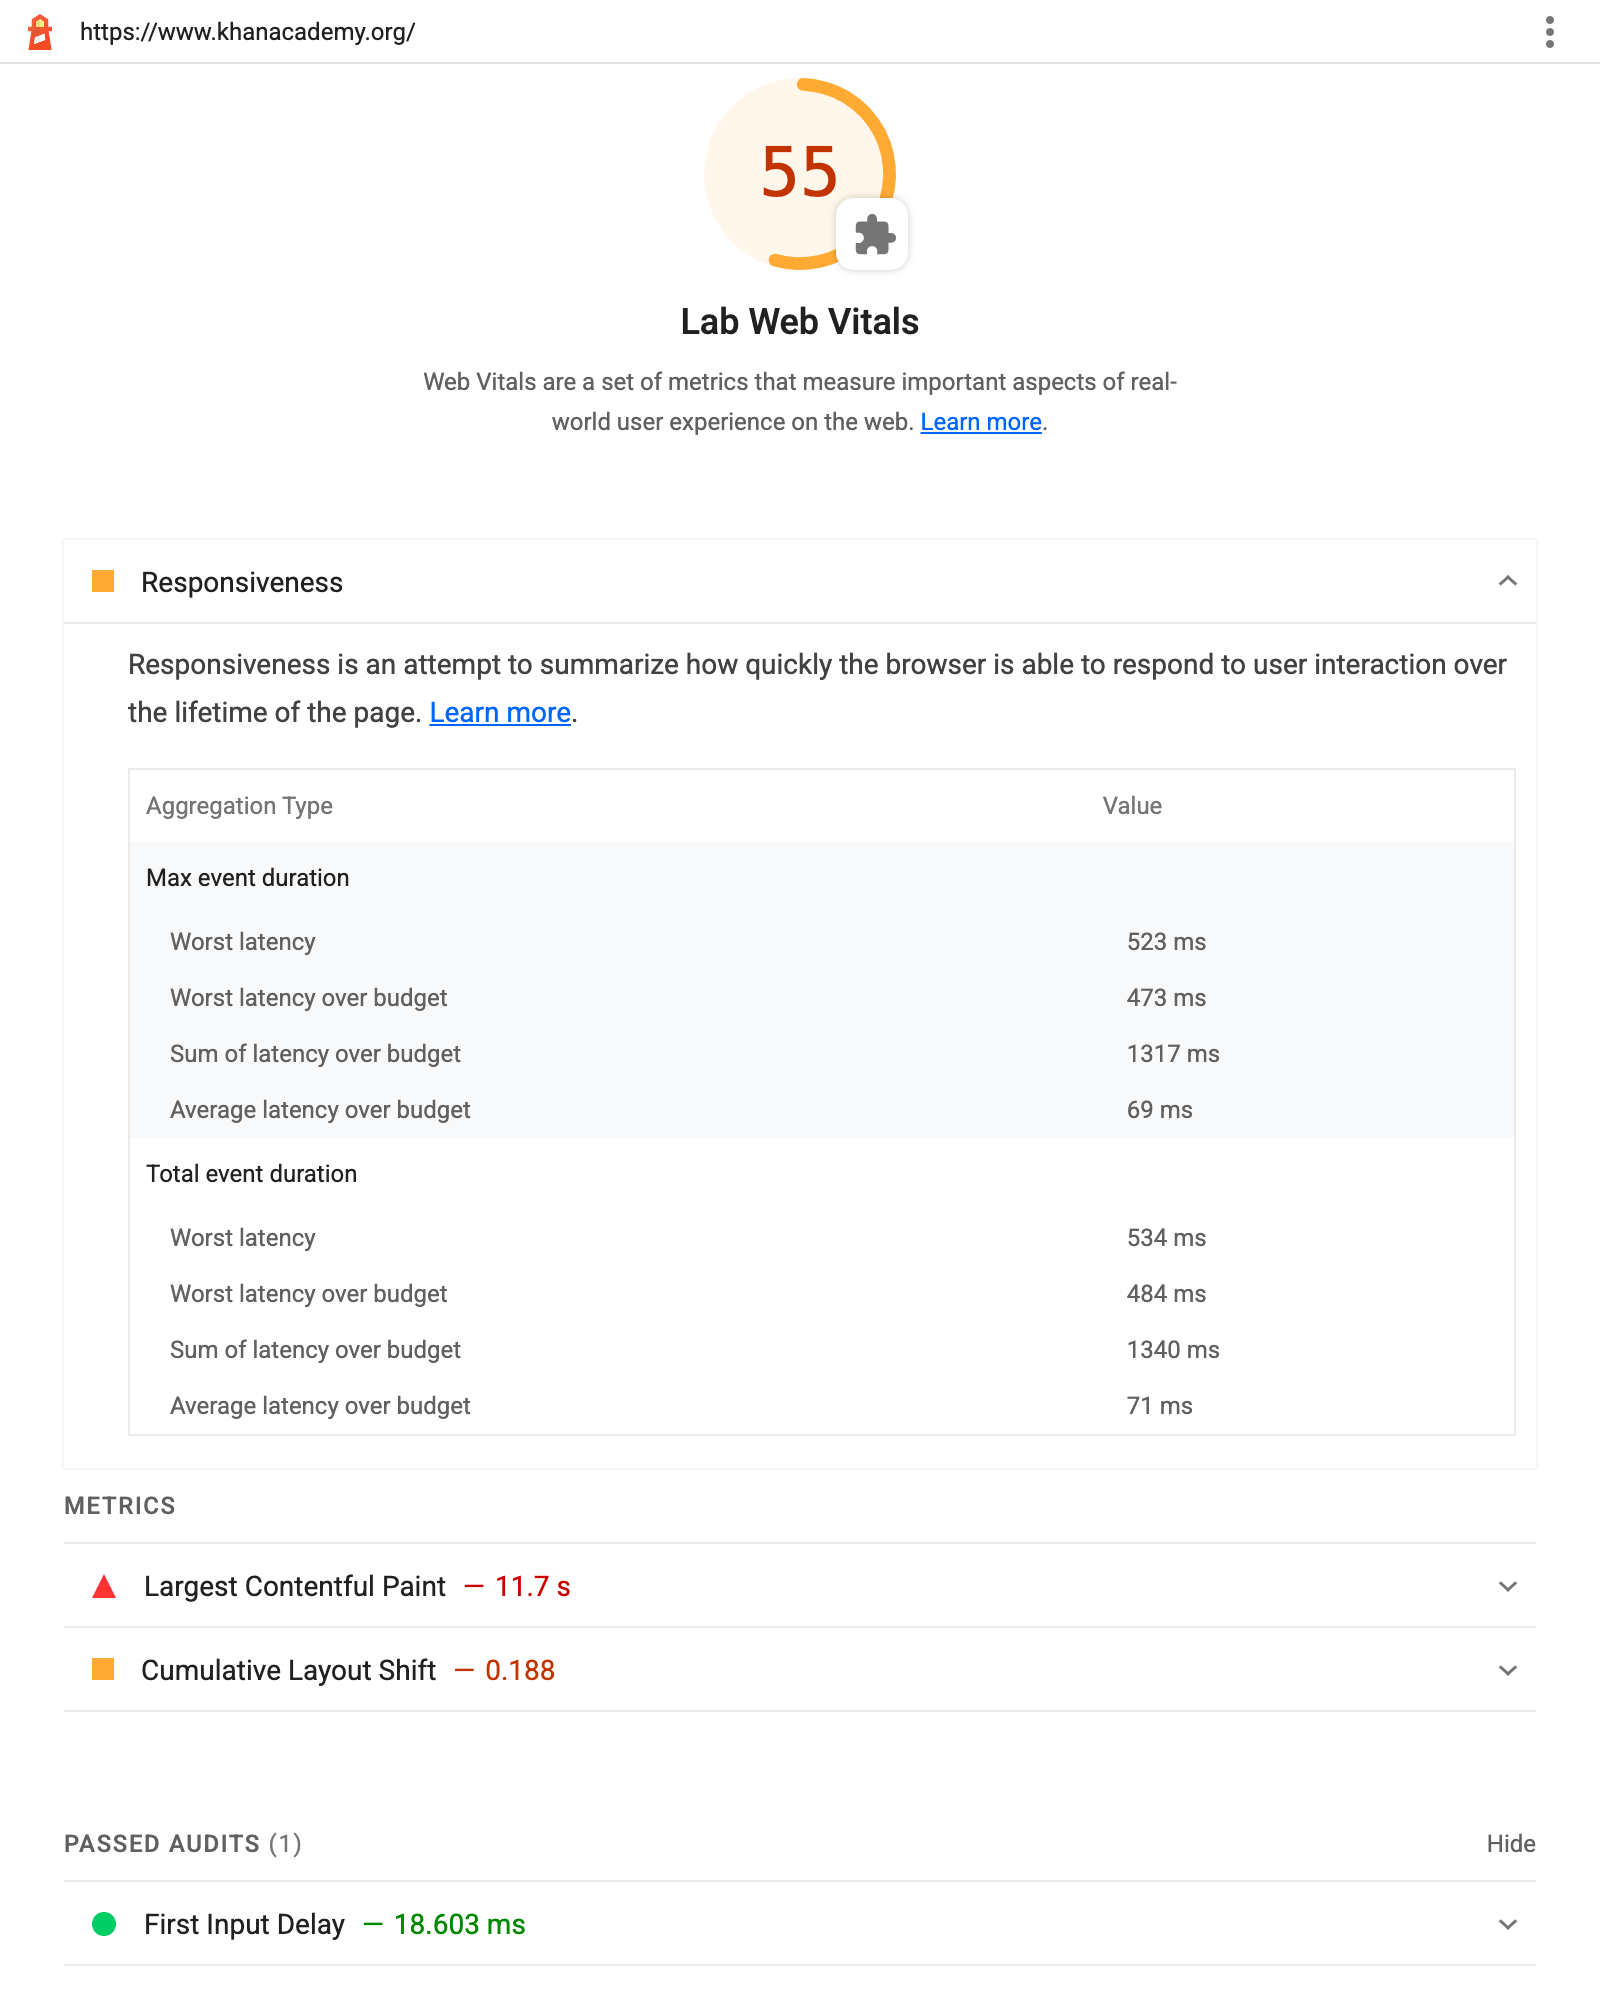
The responsiveness section in the report is where we could check the responsiveness “scores” for the website. It shows there are 4 different metrics and they all measure the responsiveness of the website. For instance, worst Latency is the maximum interaction latency among all user interactions. You can read more details from the latest post.
Thanks for reading!
We’d love to hear about your experience with the new responsiveness metric! If you have any feedback or suggestions, please send it to
web-vitals-feedback@googlegroups.com