

Amit Singh (@sans_colon) is a Senior Data Scientist at Akamai Technologies. He works on the mPulse team analyzing web performance data.
While the practice of web performance has been around for a while and the ability to study and debug JavaScript (JS) errors has improved over the years, we’ve never really looked at the impact errors have on performance.
JavaScript errors are among the more complex metrics collected by Akamai’s Real User Monitoring (RUM) tool (mPulse[1]), and as a Data Scientist, I’ve been looking at this data for a couple of years. In this post, I’ll talk about some of my findings.
The Challenge
So, where do we start when analyzing JS errors? Users of any JS error tracking service immediately observe that the number of unique errors grows incredibly fast. This makes it extremely difficult to find patterns in the data and ultimately diagnose problem areas on the site. Fortunately, many unique errors are not really so unique. In fact, many errors bear a close resemblance to one another varying only in slight differences in syntax. These variations might occur for a number of reasons such as (but not limited to):
- differences in how the browser renders the error:
- missing ) after argument list
- SyntaxError: missing ) after argument list
- The same erroneous object reference showing up at different array indices:
- Error: Cannot resolve iframe with unknown index “5”
- Error: Cannot resolve iframe with unknown index “7”
- Error: Cannot resolve iframe with unknown index “21”
- The same logical error on different variable names:
- ReferenceError: ‘$’ is undefined
- ReferenceError: ‘t’ is undefined
- ReferenceError: ‘f’ is undefined
Depending on the customer, such occurrences of similar error messages may show up anywhere from tens to hundreds of times in the JS error data. We use these commonalities to our advantage by de-duplicating[2] and performing analysis on a more manageable set of errors. For example, the second set of errors above would become a cohort of errors that follow the form “Error: Cannot resolve iframe with unknown index <*>”, where <*> is a placeholder for the index value.
Why Alerting On Error Counts Is Not Enough
Knowing when JS errors are occurring and across what pages is a vital first step in understanding the effect errors have on a site. However, simply monitoring the amount of errors occurring does not provide any added benefit to monitoring web traffic as a whole. The reason here is that many pages contain JS errors, and as such, the amount of errors is nearly perfectly correlated with the scale of web traffic. My team working on the mPulse product has introduced a metric named “Errors Per Page” as a way to combat this problem.
“Errors Per Page” is defined as the number of JS errors divided by the number of page views for the time period of interest. This allows us to become aware of and hone in on times when the number of errors spikes relative to the number of beacons. While this metric is very useful, it is unfortunately imperfect due to the nature of JS errors. There are cases where errors are widespread yet benign. That is to say, errors occurring at high rates don’t necessarily equate to poor user experience or a hit to web performance. Without knowing additional information, we cannot determine if such widespread errors are actually impactful or just happening at a high rate. For this reason, we must delve into the web performance metrics to get a clearer picture.
Performance
While slower pages often contribute to a poor user experience, it’s important to keep an eye on metrics that appear to have improved dramatically — ones that are almost too good to be true. Imagine a scenario where a page is broken to the point that the page load process is interrupted entirely and pages load extremely fast. The errors associated with these pages would likely be of interest to those responsible for monitoring the health of a site.
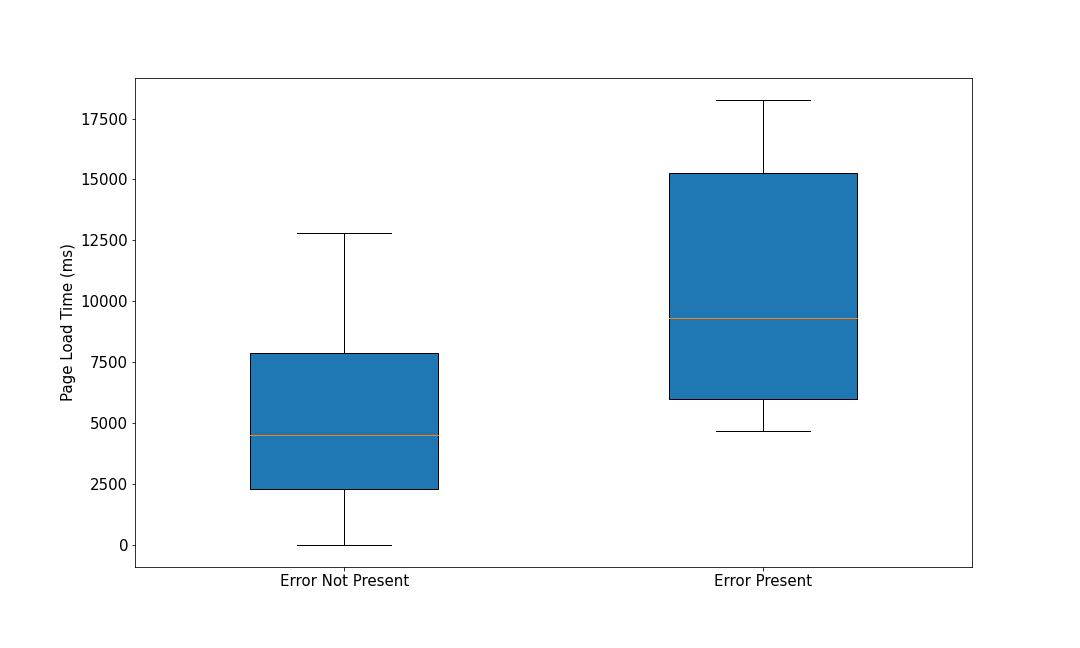
In one of our analyses, we look at pages that surface an error versus similar pages for which that particular error was not present. We then use this bifurcation to examine timings of various page load processes to see if there is a difference for when the error is and is not present. Here, we plot side by side box plot charts showing Page Load Time (ms) distributions for both cases[3].
In Figure 1 we see an example that exhibits a wide range in page load time distribution when an error is not present (left) on a website versus similar pages when this error is present (right) resulting in dramatically faster pages.

In Figure 2, we see an example of the opposite case – pages that are dramatically slower (just over twice as slow at the median) when the error is present. This situation turns out to be the far more common case.
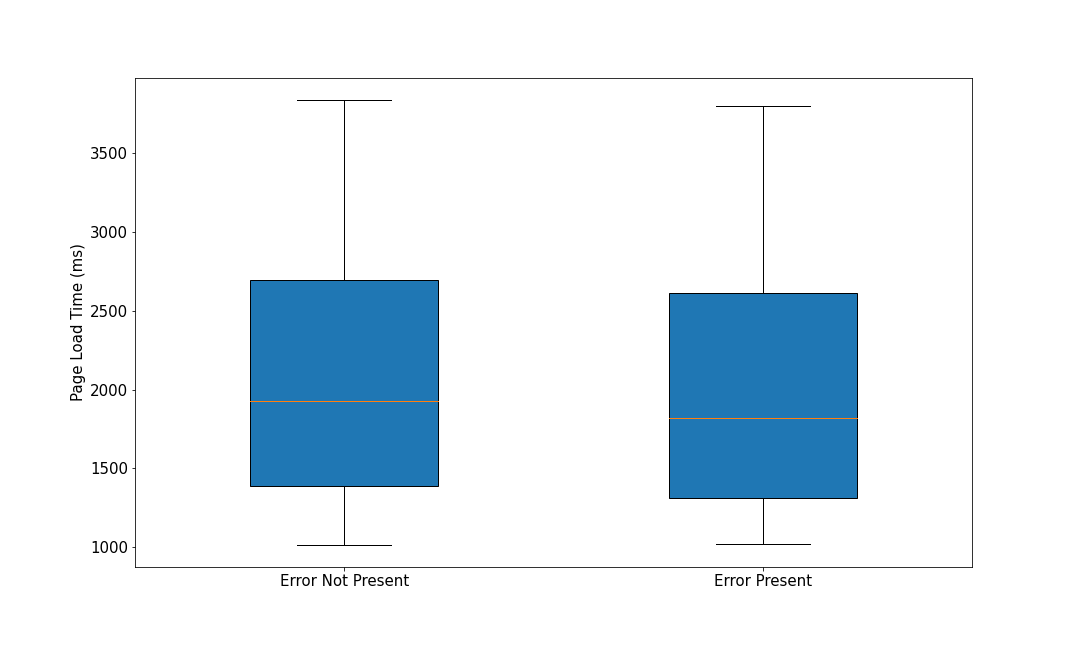
Lastly, in Figure 3, we have the case of a potentially benign error where the page load process does not differ much with or without the error present.
Indirect Side Effects of JavaScript Errors
When analyzing JS errors in RUM data, we began to think of what kinds of behavior end users may exhibit when faced with errors that are fatal or disruptive to their flow. We see in the data that the presence of certain errors lead to actions of user frustration that have bottom line implications for the business serving the site. The two most prominent cases of this are reloads[4] and abandonments (page exits).
Reloads
In the context of JS errors, we consider a reload on the next page in a session (specifically a high incidence of reloads) to be an indicator that the error itself is associated with a page that is causing user frustration. A reload could be caused by a variety of reasons, including:
- Impatience due to the page taking too long to load
- Something on the page did not render correctly
- The page is showing a non-200 level response code
The gist is that a high rate of reloads alerts us to specific problems on the page in which the error occurs.
Exits
Knowing why a user exited a page is not always obvious, especially in relation to JS errors. Often, a user exiting or ending a session is not a cause for concern. For example, consider a user that has just completed their intended action on a website (made a purchase, found and read a specific article, etc). In this scenario, exiting the site is a natural ending to the user session. However, a user may exit a site sooner than desired due to slow or broken web pages. Here, we are particularly interested in the JS errors that surfaced on these pages.
For this analysis, we examined how long a session (in the number of pages visited) continued after having visited a page with a certain error. For example, consider a session with 5 pages given by the 5 boxes below.
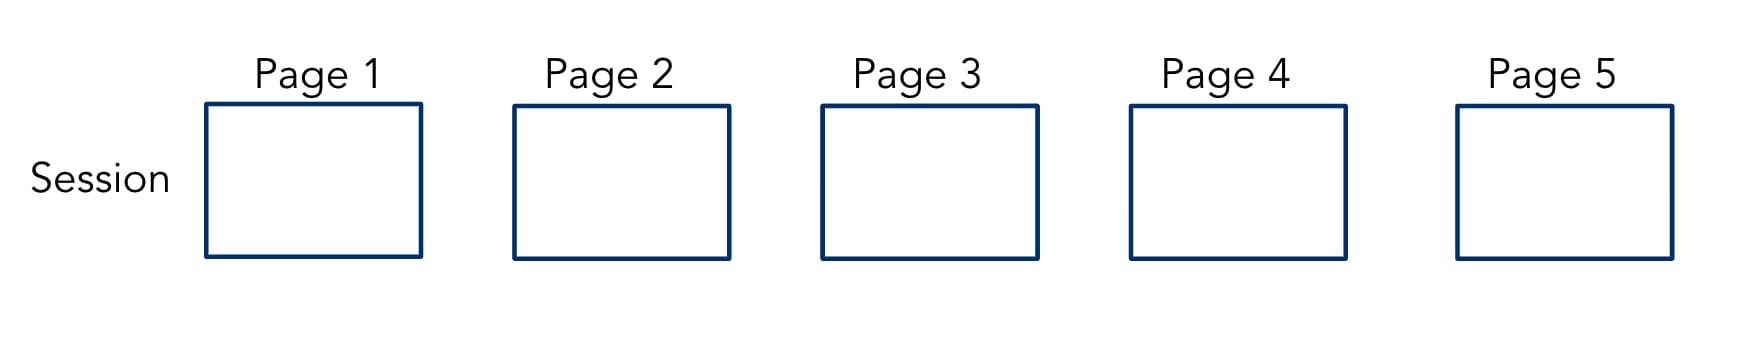
Assume that we see an error, say Error XYZ, on Page 3. Given that the session length is 5 pages, the amount of remaining pages in the session after having seen Error XYZ is 2 pages.

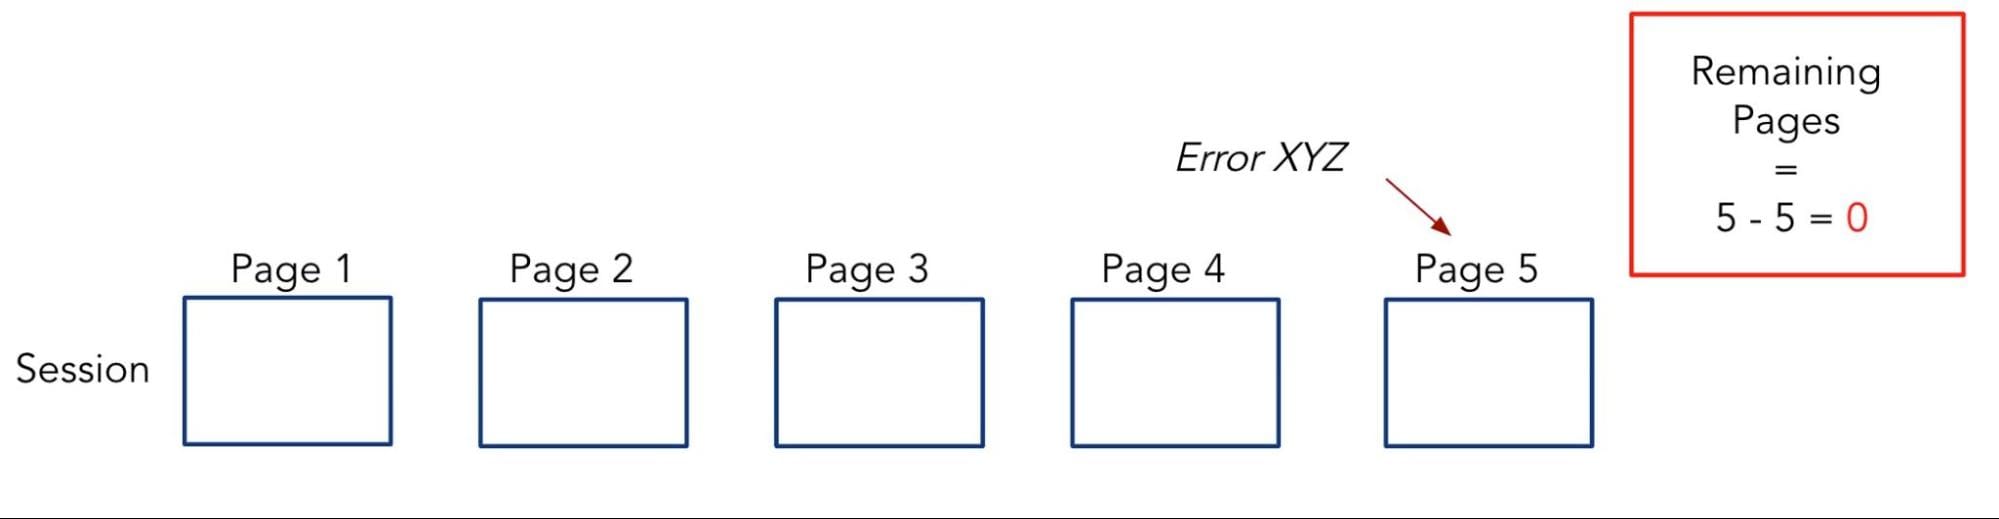
However, if we instead saw Error XYZ surface on the 5th page in the session, then the amount of remaining pages in the session would be 0. In other words, the session ended after visiting the page which had this Error XYZ.
In this analysis, we then aggregated the value of remaining pages within a session after seeing each type of error. It then became clear that there were certain errors on customer sites that were found entirely (or almost entirely) on the last page within user sessions. These would then be the errors we would dig into further to find out what may be causing the user sessions to end.
Figure 7 displays this analysis with a series of side by side box-plot charts. Each error has its own box-plot denoted by name[5] along the x-axis. The y-axis displays the remaining pages within a session after having seen the error. A wide distribution of remaining pages suggests that there are a number of possible user journeys after the error has surfaced. We may conclude that while the error may have been disruptive for some users, it did not stop a majority of users from continuing on with their session. These cases are found towards the right of Figure 7.

More interestingly, the tighter distributions towards the left of the chart show errors that appear to impact a user’s ability to continue with their session. Specifically, the four left most errors are what we are calling session killers. Each time a user visited a page where one of these errors were present, in every case, the session ceased to continue.
Often, such disruptive errors are present on a specific set of page dimension values. For example, a specific version of a browser, a specific page group, a certain operating system, a certain geographical location, or sometimes a combination of all of these. Knowing precisely where an error is causing performance degradations provides a clear plan of action for developers maintaining the health of a site.
Conclusion
As web performance tools grow more sophisticated, so do the data we collect and the questions we aim to answer with this data. While we have the data surrounding JS errors, it has not always been a straightforward problem to analyze. We aim to remove the noise from this data and pinpoint JS errors that have real performance implications and therefore cause a degraded end user experience.
Analysis around JS errors continues to be an active area of research for myself and my team. I welcome any questions, comments, concerns, and general feedback regarding the information provided above.
[1] JavaScript errors are collected with the open source boomerang.js package with Errors plugin enabled.
[2] We run a clustering algorithm based on the string edit distance between JS errors. This analysis allows us to group together errors that we presume are of the same origin based on the string returned by the error. In the above examples, we would then provide aggregate web performance metric values for the group of errors as opposed to solely individual errors. This clustering and aggregating step makes it much easier to glean insights from the data and determine the performance implications of JS errors on a site.
[3] I am intentionally omitting the specific error being discussed in each of the Figures below so as to maintain the confidentiality of customer data.
[4] A reload is given by performance.navigation.type returning a value of 1. When calculating a reload rate, we are interested in the number of times this happens on the next page in a session after having seen the error on the current page.
[5] Note that the specific error name is replaced with a randomly generated string.