
 Jane Radetska (@centzontotochti) is web development team lead for pubmed.gov. Interested in performance of websites and development teams. Recently started to blog on web development topics. In free time loves to read books and dance lindy hop. @CheViana on github.
Before a web app goes live, it is a very good idea to perform load testing: apply artificial user load to the application. I’m going to describe a couple of tips on how to prepare, run, and analyse a load testing session. Some pieces of advice may feel quite obvious, yet I hope it will be useful to have all of these tips (covered in sweat and tears) mentioned in one piece of writing.
Roughly speaking, to prepare for long term high load session:
- determine scenario and success criteria for load testing session
- instrument monitoring of all things under load
- run preparatory sessions before unleashing high load
The load testing process usually goes something like this:
- unleash load on web app
- something breaks
- stop the load
- tune/fix/adjust
- load it up again
- …
Repeat until complete long-term high-load session results meet the success criteria.
Metrics, targets and testing scenario
First of all, one needs to determine what is the amount of load the application is expected to withstand, what kind of requests should be used to generate the load and what would be an acceptable web app error rate and response time (and possibly other success criteria).
Scenario and load level
By scenario I mean which web app URLs load testing tool should hit. Here’s an example load testing scenario:
120 simulated users query the web app:
  - 10% requests hit the home page - `GET https://musicstore.com/`
  - 25% hit the product list page - `GET https://musicstore.com/shopnow/?p=1`
  - 60% hit the product detail page - `GET https://musicstore.com/fancypiano123/`
  - 5% submit an order - `POST https://musicstore.com/buy/`
Where can one get these numbers, and which URLs should be in the scenario at all?
Rewriting an existing app
If a new web app is replacing an existing one (which is really true for a majority of new apps), one can mine the logs of the legacy application. It’s ok to only include high-hit pages in the scenario. E.g. from logs collected over the last month, total sum of hits to home, product list and detail pages is 98.3% of all hits, and other page types account for max 0.1% hits per page type. For such a case, load testing scenario can include only home, product list and detail page hits. However, it is important that hits to other page types won’t bring the whole web app down. If “other page types” are all just static pages, there is probably no need to include them in the scenario. If there are page types which are not hit frequently but are heavy on resource usage, it might be a good idea to include these in the main scenario or run separate smaller-scale load testing session for them, possibly with adjusted success criteria.
Now there’s the question of how much load should the tool apply to web app. That is also a question which you can answer using logs/monitoring of the legacy app. It’s likely the case that user load for the legacy app fluctuates a lot during the course of day or week. Determine the min, avg and max RPS legacy app handled during, say, last month (same datetime range used in previous analysis of how load should split between page types), and swing from there. I suggest the following formula for RPS in load testing session:
max(avgRPS * 4, 3 * maxRPS)
The simplest formula that’s good enough for most apps is:
3 * maxRPS
If user traffic is anticipated to grow in future, use anticipated future maxRPS instead of one derived from logs.
There is another way to think about target load – in terms of simultaneous users. One can compute what is the max amount of users querying the app at the same time, and use that for the value of simulated users in a load testing session. A lot of load testing tools allow you to specify the amount of simulated users, but not target RPS. Some load testing tools allow you to write the scenario this way: simulated user queries home page, then product list, then product list page 2, then product detail, then checkout. It is good idea to investigate both RPS level and simultaneous users level, and make sure both of those are covered with a big gap by the amount of artificial load that is going to be applied.
Brand new apps
What if the app is completely new and there are no logs to mine? Then one might brainstorm together with business folks some scenarios which best predict the app usage, and possibly use higher value in N * maxRPS formulae for the load level.
Keep scenarios close to real life
Simulated user request should be close to real life. If the app users are live people (not other apps), it makes sense to introduce a small delay between requests a simulated user makes (e.g. using JMeter’s random timer).
It is also worth taking a look at the HTTP connection settings used by the load testing tool. It might make sense to reuse HTTP connection for requests from the same artificial user for some number of requests, to simulate user interacting with the web app in the browser better. It might also be worthwhile to set the HTTP version and adjust other options like socket timeout (configure JMeter’s LoopController.loops for thread group, set HttpClient to HttpClient4 class).
There is also a question of parameterizing artificial users requests. Users don’t all view the same product detail page, they view different products. The scenario should account for that – e.g. take product ID from some big pool of popular product IDs, so that requests aren’t all https://musicstore.com/fancypiano123/, but https://musicstore.com/fancypiano1/ , https://musicstore.com/fancyguitar3/ , https://musicstore.com/fancydrums8/…
Same is also true for product list pages – users view page 1, page 2, use different sorting, different paging sizes. Test sessions should query parametrized URLs, with huge pool of param values, to keep cache usage close to real life, among other things. Good enough pool of param values could be a list of product IDs users viewed during last month.
Here’s how to configure parametrizing for JMeter (XML of scenario file):
<HTTPSamplerProxy ...>
    ...
    <stringProp name="HTTPSampler.path">/${productID}/</stringProp>
    ...
</HTTPSamplerProxy>
<hashTree>
    <CSVDataSet guiclass="TestBeanGUI" testclass="CSVDataSet" testname="CSV Data Set Config" enabled="true">
        <stringProp name="delimiter">,</stringProp>
        <stringProp name="fileEncoding"></stringProp>
        <stringProp name="filename">/path/to/ids.txt</stringProp>
        <boolProp name="ignoreFirstLine">false</boolProp>
        <boolProp name="quotedData">false</boolProp>
        <boolProp name="recycle">true</boolProp>
        <stringProp name="shareMode">shareMode.all</stringProp>
        <boolProp name="stopThread">false</boolProp>
        <stringProp name="variableNames">productID</stringProp>
    </CSVDataSet>
<hashTree/>
A scenario can also have a “ramp up” time configured – it won’t unleash all simulated load at once, instead load will grow bit by bit during a pre-configured time. This might reflect real life even better, for example when a canary rollout strategy is used. (Use JMeter thread group options to configure ramp time).
Server response time target
Google recommends to keep server response time below 200ms. Time-to-first-byte is server response time plus the time it takes the web response to travel over the wire to the user (in case there’s no edge caching involved). I don’t think I have to stress the importance of TTFB for web apps, which directly depends on server response time. What I want to mention though is that it is possible to measure response time at the different layers of web app “onion”:
- avg response time reported by the web app itself (e.g. uWSGI avg worker request time)
- avg response time reported by the load balancer in front of the web app (if there’s one)
- avg response time reported by the gateway server in front of the load balancer (by “gateway” I mean the endpoint which is first in the chain of servers/infrastructure you have control over, first to accept user requests and route them downstream)
A particular app’s “onion” can be different, but I hope you grasp the point. I find it most beneficial to measure response time on the gateway layer (the outermost onion layer), the web app layer (the innermost onion layer), as well as load testing tool level. It is probably a good idea to have monitoring and logging on all other onion layers, as long as it does not significantly penalize performance.
It makes sense to run the load testing tool outside of web app environment, to emulate as close as possible how user requests are going to be made – load testing requests should flow through all the pipes real user requests will flow through. This way the tool’s reported response time can be thought of as TTFB approximation.
Response time and error rate reported by the load testing tool could be significantly affected by things like traffic loss en route, and such things tend to be tentative as hell and skew results when you’re trying to compare the results from two sessions run on different days. This is one of the reasons it’s a good idea to run a (big final) load testing session for a significant amount of time, like a day or a week or even a month. And if you’re trying to measure the impact of some changes introduced in the web app onion, it is a good idea to run load tests at the same time on two endpoints (base and modified), or to run sessions as close in time as possible.
My advice is to look at both gateway server reported response time and load testing tool response time, making sure the later fits the SLA, and using the former as a main metric in comparative sessions, as gateway server reported response time deviates less, is less affected by factors which you don’t have control over and factors which can change significantly over time.
I also want to mention that for response times it might make sense to use not avg but say 95 percentile value, or use both with different targets for avg and for 95 percentile.
It might also make sense to have different target values for different web app pages, e.g. a static home page to be super quick and a detail view to be allowed to take a bit more time.
Error rate target
Target error rate could be:
Allowed errors <= 100% - SLA uptime target
… for example 1% (as reported by the load testing tool). If there’s no SLA set for the product, it is probably a good idea to talk to project management to adopt one. Even as primitive SLA as “Uptime 99% (as reported by periodic external probe), avg response time (on the gateway level) <= 300msec, max time to resolve outage 4hr” will likely save a lot of headache when outage occurs.
Most things said for the response time are true for other metrics you decide to use as success criteria – error rate, etc. Specific to error rate metric is the question of what to count as an error: 50x response, 40x response? Should there be different targets for different response statuses? Those are application-specific questions, and it is common that business side dictates them.
It is likely a good idea to count very long executing requests (10 seconds?) as failures, unless this is something expected for particular web app views. Yet that is anti-pattern, strictly speaking, to have very long-executing requests served by regular web app workers, those should be decoupled from web app.
Scenarios used by the load testing tool usually contain a definition of “success hit” which can be tweaked to suit your app needs. (JMeter’s ResponseAssertion and DurationAssertion).
Load testing tools
There are plenty of load testing tools available – this post lists some of them.
One long-existing tool used by lots of people is JMeter. It’s a good fit for those who need an involved scenario and prefer GUI interactions over writing code. It’s possible to run it with master+worker nodes setup from cloud (how to do it), or use pay-for online-based platforms which run JMeter for you.
Another tool which gains popularity quickly particularly for cloud-based setup is k6. It’s a good fit if you don’t mind JavaScript and need something cloud-native. GitLab has an example on how to run k6 in a job (possibly for a short term load session as part of app rollout). Alternatively, one can run k6 in separate from web app cloud project instead.
One more simple tool which is also very powerful is wrk2. It allows to specify target RPS. Good fit if you have one static URL to test, or for use in simpler preparatory testing.
In case you’re good with Python and don’t need high RPS level, locust might be a good fit. It is rather easy to write a scenario for.
Preparatory, supplemental and resilience sessions
Preparatory sessions
It makes sense to first load test the backends and DBs the web app uses – calculate what load is expected for the backend, and apply that directly to the backend. The load tool probably needs to be inside your infrastructure for such session. Make sure backends and DBs the web app uses are handling load alright (satisfy SLA), then switch to load testing web app itself. It might be cheaper this way – load tests are expensive in terms of burned resources.
It’s a good idea to run a smaller load session for a web app before starting the big load: same scenario as for high load with reduced load and shorter duration. E.g., load test one web app pod, make sure it works OK for CPU load level up to scaling threshold value, then proceed to testing under high load.
Supplemental sessions
Among other kinds of sessions highly advised to perform are “rectangular load” session and “spike” session.
“Rectangular load” is a session in which simulated user load has a form of rectangle: 20 RPS for 15 min, 10 RPS for 15 min, 20 RPS for 15 min, etc.
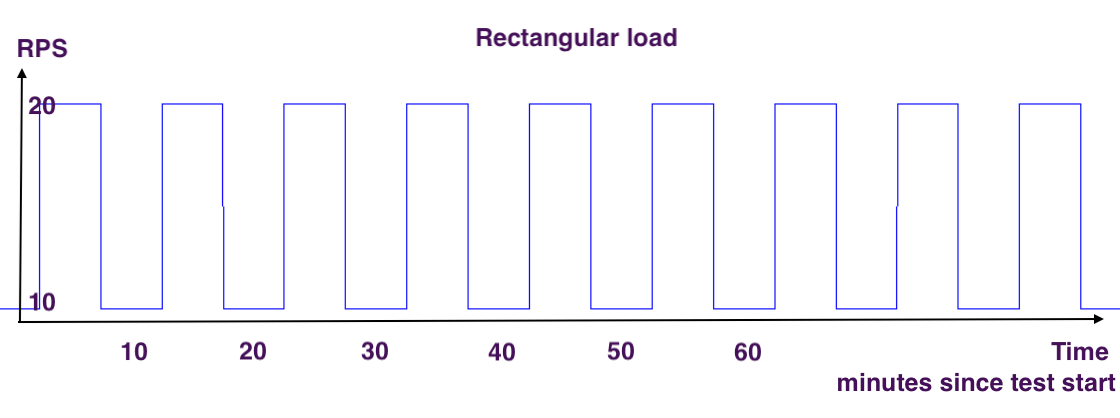
Let’s say initially the web app stack has 2 pods in a stack, when hit by 20 RPS it scales up to 4 pods, when load decreases to 10 RPS it scales down to 2 pods, etc. It could be an abrupt switch from 10 to 20 RPS or it could be a gradual change. For abrupt changes one can possibly expect a bit of errors during the “uphill” switch from 10 to 20 RPS. It’s best if those errors don’t exceed SLA level. This type of session allows you to look at how well the web app scaling is tuned: how quickly can the web app stack scale up, whether requests are dropped when the app downscales. JMeter can be configured to produce “rectangular” load using programmable timer like this one:
<JSR223Timer guiclass="TestBeanGUI" testclass="JSR223Timer" testname="JSR223 Timer" enabled="true">
    <stringProp name="cacheKey">false</stringProp>
    <stringProp name="filename"></stringProp>
    <stringProp name="parameters"></stringProp>
    <stringProp name="script">import java.util.Date;
Date date = new Date();
Long minutes = date.getMinutes();
Long minLastDigit = minutes.mod(20);
if (minLastDigit < 10 ) {
	log.info("Even minute: adding timer");
	return 1000;
} else {
	return 100;
}</stringProp>
    <stringProp name="scriptLanguage">groovy</stringProp>
</JSR223Timer>
<hashTree/>
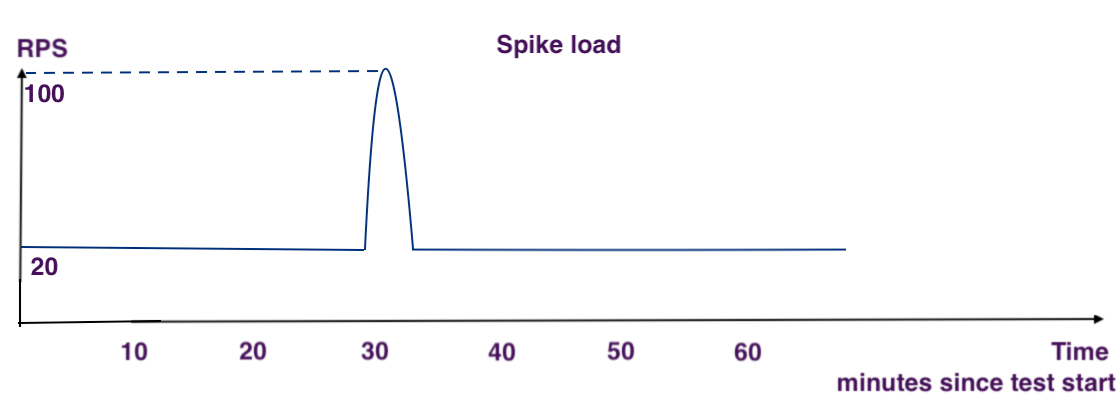
A “spike” session is a simulated short-time spike in load level. It is expected to encounter elevated error levels during the spike. Of most interest is how the web app stack recovers: it should be able to work normally (satisfy SLA) after the spike is gone, all on its own, without developer’s help. One can load the web app with regular scenario using third of load level, and use another instance of load testing tool to create short-term spike.
Resilience sessions
Resilience testing is a big part of the preparation to go live. This type of session helps tune backend timeouts and retries better. One example is a the simulated backend outage during high-level load test session. One would expect no impact (low impact) on testing results when an optional backend goes down. If the backend is required for web app to produce its main content, it is of course expected that error rate will increase and response time decrease, when backend stops responding. Of most interest is to see how well app recovers after backend outage ends, and how well other web app pages that don’t use the backend are working when that backend is down. It could be OK from the business perspective for app to be completely down when a particular dependency is down, yet it is still advised to emulate as many kinds of outages as you can imagine, to check how expectations are working out, and that alerting bells are ringing. It is also prudent to emulate backend stopping to respond completely, as well as significant increase of backend response time.
In addition to backend outages, don’t forget about other possible kinds of outages, e.g. cache. It’s a good idea to tune caching policies, to set how cache should behave when its memory usage reaches maximum configured memory, and to test how the app behaves when the cache is close to saturation. And test out monitoring for cache saturation if there’s one.
Outages are best tested over main high load scenario, it doesn’t have to be a long-running session.
Load testing environment
Rule of thumb is to not share any infrastructure, backends, caches, anything used by application under load test with the live production-serving apps. Simple as it sounds, it might be not easy (and not cheap) to achieve. It could be an option to run load tests during off-peak hours, if you’re feeling lucky. In case you’re not testing high-load apps, say its 1 RPS load testing session, it might be ok to share infrastructure, yet it still possesses risks as new things are being loaded, and unexpected things can happen. If the load session is run in production environment, it’s highly advised is to keep it under close observation and terminate load quickly if something goes wrong.
Instrumented monitoring for web app itself, webserver, backends, caches, infrastructure is extremely helpful for diagnosing issues that surface during load testing. One feels blind and helpless without it.
Results reporting
A really nice thing about modern load testing tools is that some of them can be configured to report load testing results in real time, e.g. it is possible to make JMeter emit current RPS, error rate, response time to a db which will power real-time dashboard. Online-based platforms which run load testing tools for you usually provide such monitoring too. It is especially helpful for long-duration test sessions.
It’s a very bright idea to document all load testing session results. It can make sense to devise a script that automatically produces a report page. I usually include following information into the report:
- justification for the test session (why was it run)
- success criteria for the test session, whether it was met overall
- datetime when the session started and stopped
- max load level
- results that the load testing tool reports, and whether those meet success criteria (error rate, response time, etc)
- results gateway server reports for load testing traffic, and whether those meet success criteria
- links to monitoring dashboards for web app, infrastructure, etc
- links to logs of the web app for the duration of the load test
- something that identifies particular web app code version which was used (commit SHA). Possibly same for backends, and other pieces of infrastructure, like version of load balancer. Doesn’t have to list versions for everything, list whatever makes sense for the particular app case.
- description of the environment in which the web app and its dependencies were spawn (cluster name, GKE project name, deployment names)
- file with the scenario which was employed to run the session
- list of any problems surfaced during the session, investigation and mitigation notes
Last piece of advice – don’t get load testing tool’s logs to fill up all free space, and halt the load. Provision enough log space, or turn it off in favor of real time monitoring.