

Brian Louis Ramirez (@screenspan@mastodon.green) worked for many years in UX before falling in love with web perf. He blogs at https://screenspan.net/.
When I worked as a web performance consultant for a large company with dozens of websites and sub-divisions, I came across different tech stacks, team structures and processes. The larger the organization behind a website, the more difficult it was to make big changes. Generally, it was way easier and quicker to optimize perf when only a single team or agency maintained a website.
Before I left that employer, I asked myself how I could help them the most — how I could best send them along their performance journey.
I reasoned I could help them the most by answering the questions:
- How good or bad is our performance?
- What are the biggest bottlenecks and opportunities?
- What can we do to promote or maintain a culture of performance in the long run?
And while the first two questions were easy enough to answer with a performance audit, the last question forced me to view performance through a wider lens.
Alex Russell’s “A Management Maturity Model for Performance” was for me that wider lens. It describes how organizations approach performance — from being ignorant of problems at the lowest level (Level 0), to optimizing perf strategically through experimentation at the highest level (Level 5). Alex stresses that progress to or regression from a higher level is not necessarily a technical matter, but rather a matter management and team mindset.
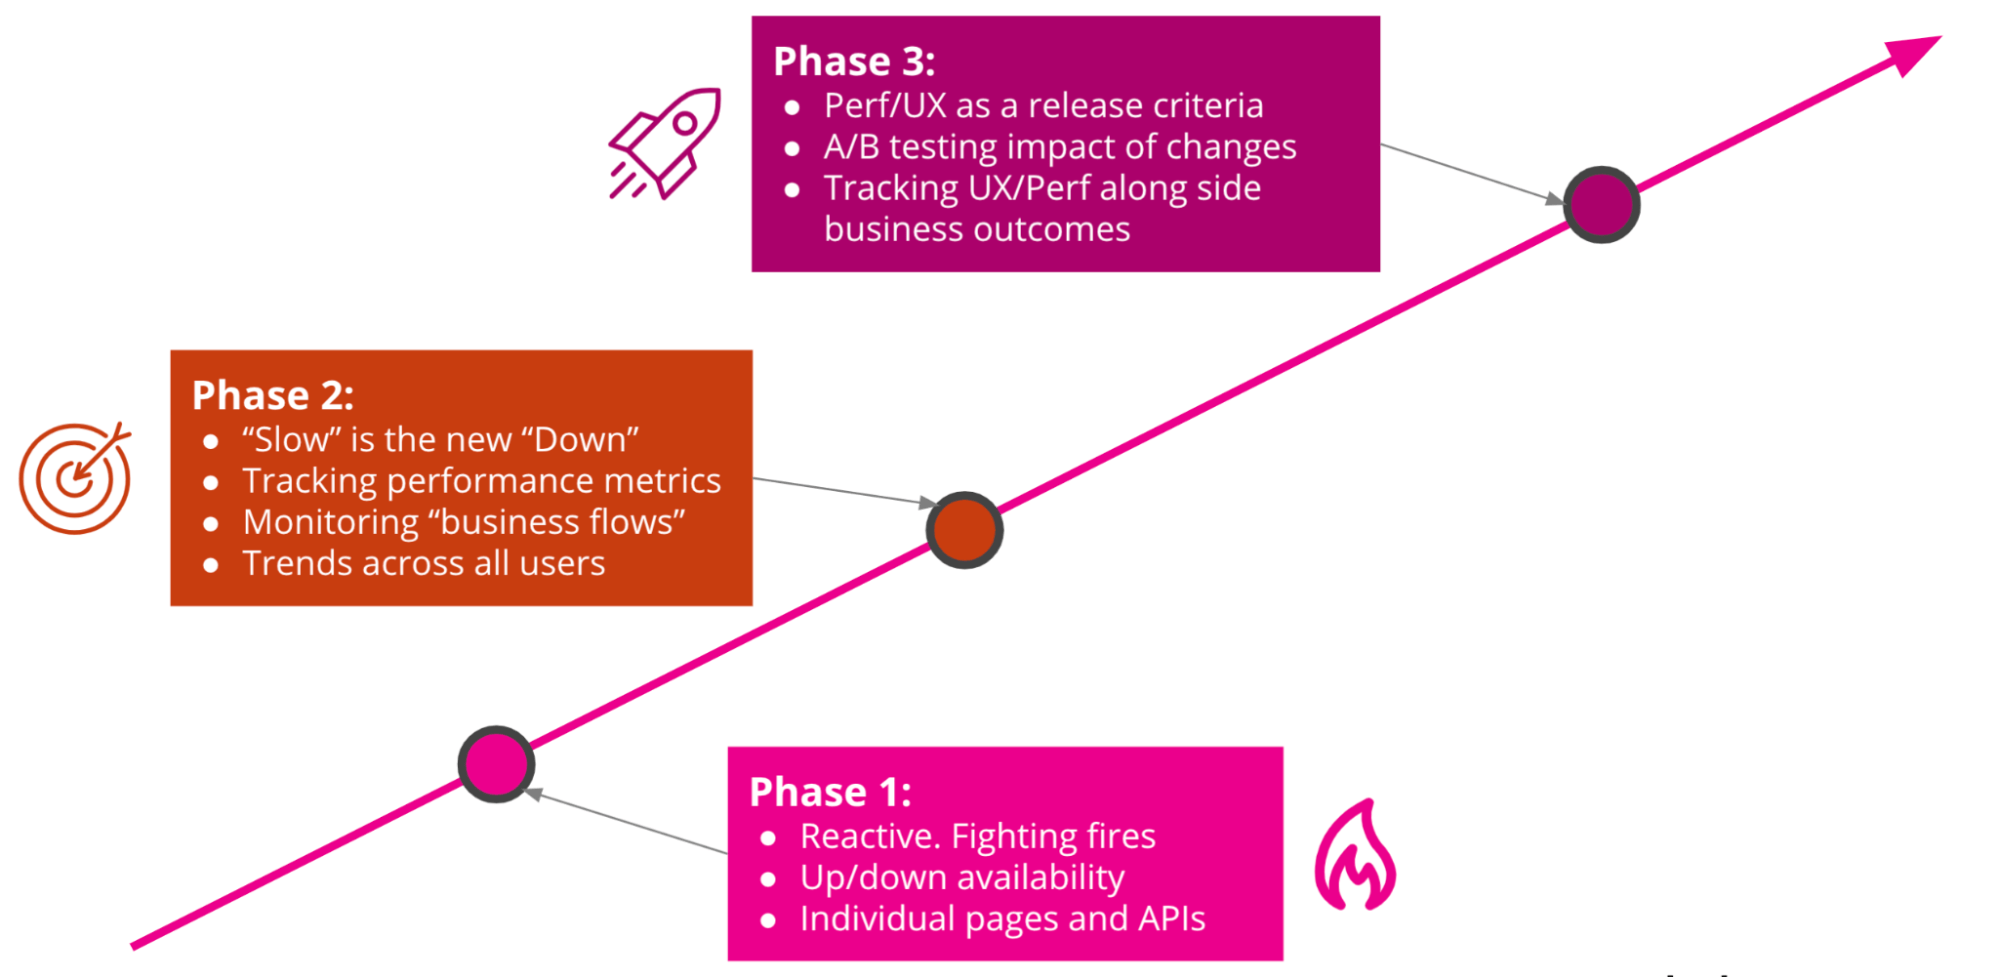
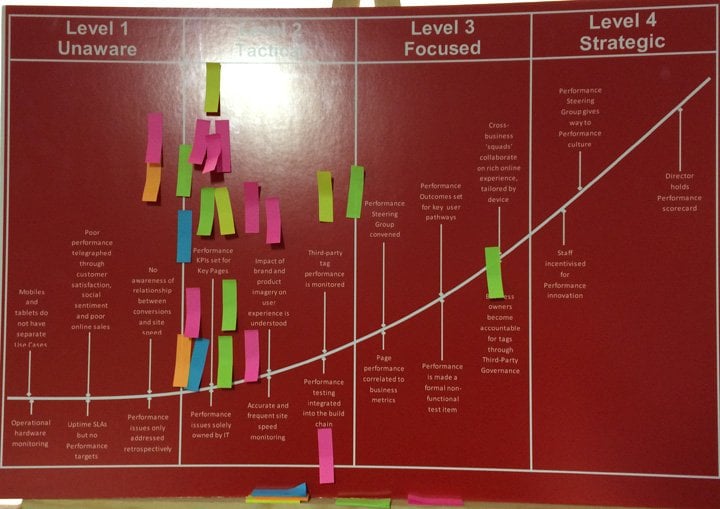
Alex also refers to the three-phase “Web Performance Maturity Curve” by the Splunk team and a more graphical maturity model by @NCCGroupWebPerf@twitter.com. Both showed different levels and aspects of perf maturity.
Drawing upon each model, I tried to roughly gauge the perf maturity of organizations, but found I needed a more visual aid — a map of perf work that I would help me identify where orgs are in their perf journey: what areas of performance there are and what level they are in those areas.
So I drew up a “Performance Maturity Matrix” with four levels including a “null” level (i.e. lacking the traits of performance maturity) and nine areas of perf work.
The Performance Maturity Matrix
| Level 0 | Level 1 | Level 2 | Level 3 | |
|---|---|---|---|---|
| Goals | Maintain uptime | Improve perf on key pages | Avoid regressions | Test optimizations |
| Strategy | Avoid downtime and react to critical problems (fire-fighting) | Define perf targets and raise awareness for perf | Establish perf budgets and enforce them in CI pipeline | A/B testing impact of changes, regularly audit 3rd-parties and set up alerts |
| Metrics | Technical metrics (e.g. page load) | Technical metrics (e.g. page load) | UX metrics (e.g. Core Web Vitals) | Custom metrics / KPIs |
| KPIs | Uptime | Average page load time | 75th percentile of UX-relevant metrics | >75th percentile product- and UX-relevant metric |
| Monitoring | none | Synthetic perf monitoring | Real User Monitoring (RUM) | RUM data includes business metrics and is segmentable by demographic |
| Competitors | benchmarks unknown | Ad hoc comparisons | Competitor monitoring | Perf is a competitive advantage |
| Knowledge-sharing | Post-mortems | Perf audits | Regular reporting (also to management) and monitoring | Teams use custom dashboards; perf is part of onboarding; sharing between orgs |
| Personnel | No dedicated expert | Solitary perf experts or consultants | Perf steering group / guild | Dedicated perf team |
| Ownership | IT | IT + UX | IT + UX + Marketing | Entire organization |
How to use the matrix
First off, go over the matrix for an organization, working from the top left to the bottom right box. Color in the boxes:
- Green = level reached in an area
- Yellow = level partly reached or at risk in an area
- Red = level not reached in an area
That leaves me with a map of problem areas and a rough ideas and how capable or enabled an org is to deliver performant experiences like this:
| Level 0 | Level 1 | Level 2 | Level 3 | |
|---|---|---|---|---|
| Goals | Maintain uptime | Improve perf on key pages | Avoid regressions | Test optimizations |
| Strategy | Avoid downtime and react to critical problems (fire-fighting) | Define perf targets and raise awareness for perf | Establish perf budgets and enforce them in CI pipeline | A/B testing impact of changes, regularly audit 3rd-parties and set up alerts |
| Metrics | Technical metrics (e.g. page load) | Technical metrics (e.g. page load) | UX metrics (e.g. Core Web Vitals) | Custom metrics / KPIs |
| KPIs | Uptime | Average page load time | 75th percentile of UX-relevant metrics | >75th percentile product- and UX-relevant metric |
| Monitoring | none | Synthetic perf monitoring | Real User Monitoring (RUM) | RUM data includes business metrics and is segmentable by demographic |
| Competitors | benchmarks unknown | Ad hoc comparisons | Competitor monitoring | Perf is a competitive advantage |
| Knowledge-sharing | Post-mortems | Perf audits | Regular reporting (also to management) and monitoring | Teams use custom dashboards; perf is part of onboarding; sharing between orgs |
| Personnel | No dedicated expert | Solitary perf experts or consultants | Perf steering group / guild | Dedicated perf team |
| Ownership | IT | IT + UX | IT + UX + Marketing | Entire organization |
For example, if an organization has synthetic performance monitoring (Level 1) but doesn’t have Real User Monitoring (RUM, Level 2), then I’d recommend setting up a RUM tool to have better and more precise numbers with regards to the experience of performance. And if they don’t yet monitor competitor pages using their synthetic tooling, then I’d recommend that. Or in the area of personnel, if an organization doesn’t have any dedicated perf experts (Level 1), I’d recommend that team members do some additional training in performance optimization techniques, hire experts or work regularly with external perf consultants.
While you can use the matrix to gauge an organization on your own, you could do a workshop and invite others from within the org to help fill it out. That might help to gain awareness for problem areas.
Got feedback?
I by no means assume to have a complete picture of performance work in all organizations. So I want to tap into your experience, dear reader.
- Does the matrix reflect the areas of web performance organizations that you’ve come across?
- What’s missing or unclear in the matrix?
- Are four levels too few or too many?
Please send your feedback to me @screenspan@mastodon.green.