

Sia Karamalegos (@sia) is a web developer and performance engineer, currently working on web performance at Shopify. She�s also an international conference speaker, writer, Google Developer Expert in Web Technologies, Cloudinary Media Developer Expert, and Stripe Community Expert. She co-organizes the Eleventy Meetup which won the 2021 Jammies Award for Outstanding Community Meetup.
Much like a carpenter or handyperson, every web performance expert has a set of their favorite tools. Whether you’re new to performance or simply wanting to snoop on other people’s processes, here’s my own toolbox favorites and why.
To give you a bit more context, I currently work at Shopify helping merchants improve their web performance, but I’ve also helped many companies make their sites faster before as a freelancer. In essence, I am a consultant who is frequently on the outside looking into a website and doesn’t have access to the source code or proprietary analytics tools.
Don’t hate me if I didn’t include yours! Instead, reach out to me to tell me about it. What are your favorite tools?
#5: SpeedCurve

While SpeedCurve is my #5 tool on this list, it’s my #1 tool for managing real user monitoring (RUM). Since I function mostly as a consultant, and my personal site is static, I do not need to spend a lot of time on managing RUM otherwise this might bump up to #1.
SpeedCurve is great not only because it tracks your RUM data, but you can also use it for lab testing, incorporating performance testing into your CI/CD process, benchmarking your competitors, and for setting up alerts when your performance degrades.
#4: Lighthouse Treemap
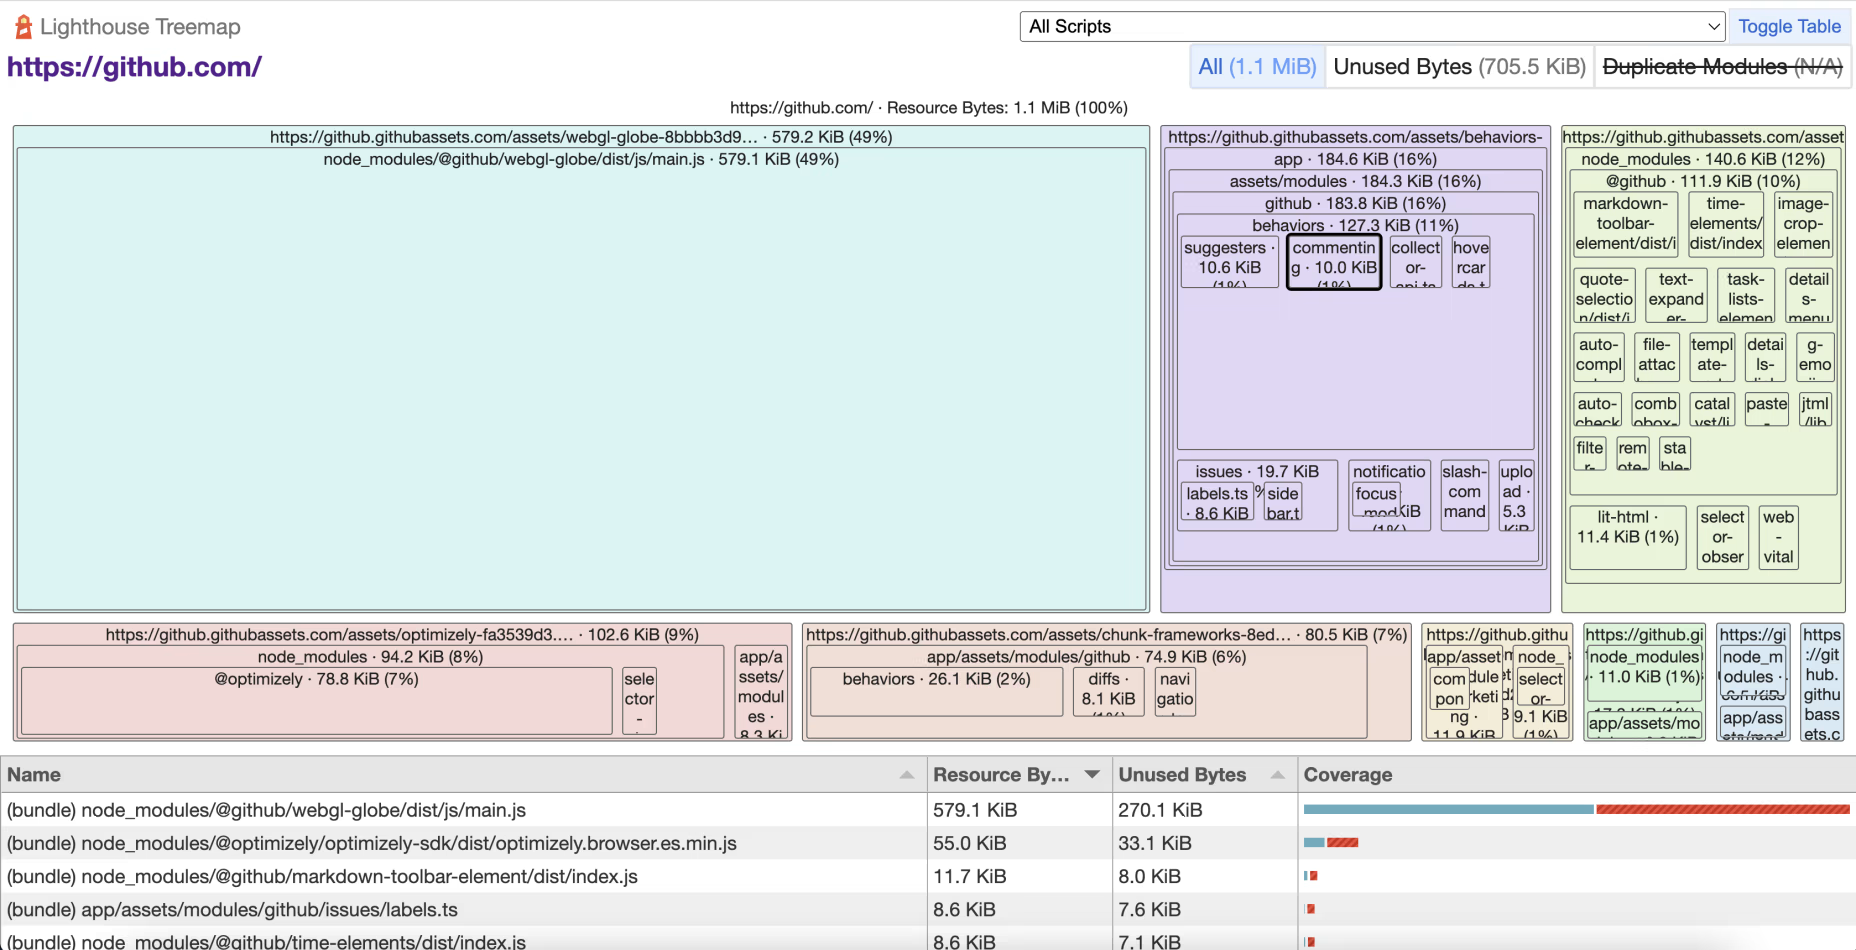
As many of you know, JavaScript is your most expensive asset. However, as a consultant, I’m often the outsider looking in trying to get a better view of the scripts used on a page. Even if a client has a bundle sizes tool in their build process, I won’t have access to it unless I have access to their code base. More often than not, they don’t even have that.
This is why I was super excited when Lighthouse Treemap was launched. I wrote a more detailed article about it at that time. In short, it lets us visually see all the JavaScript loaded on a page so that we can quickly see which ones are the largest and also the proportion of code used/not used on load. Check out the article to learn more.
#3: Chrome Dev Tool’s Performance Tab
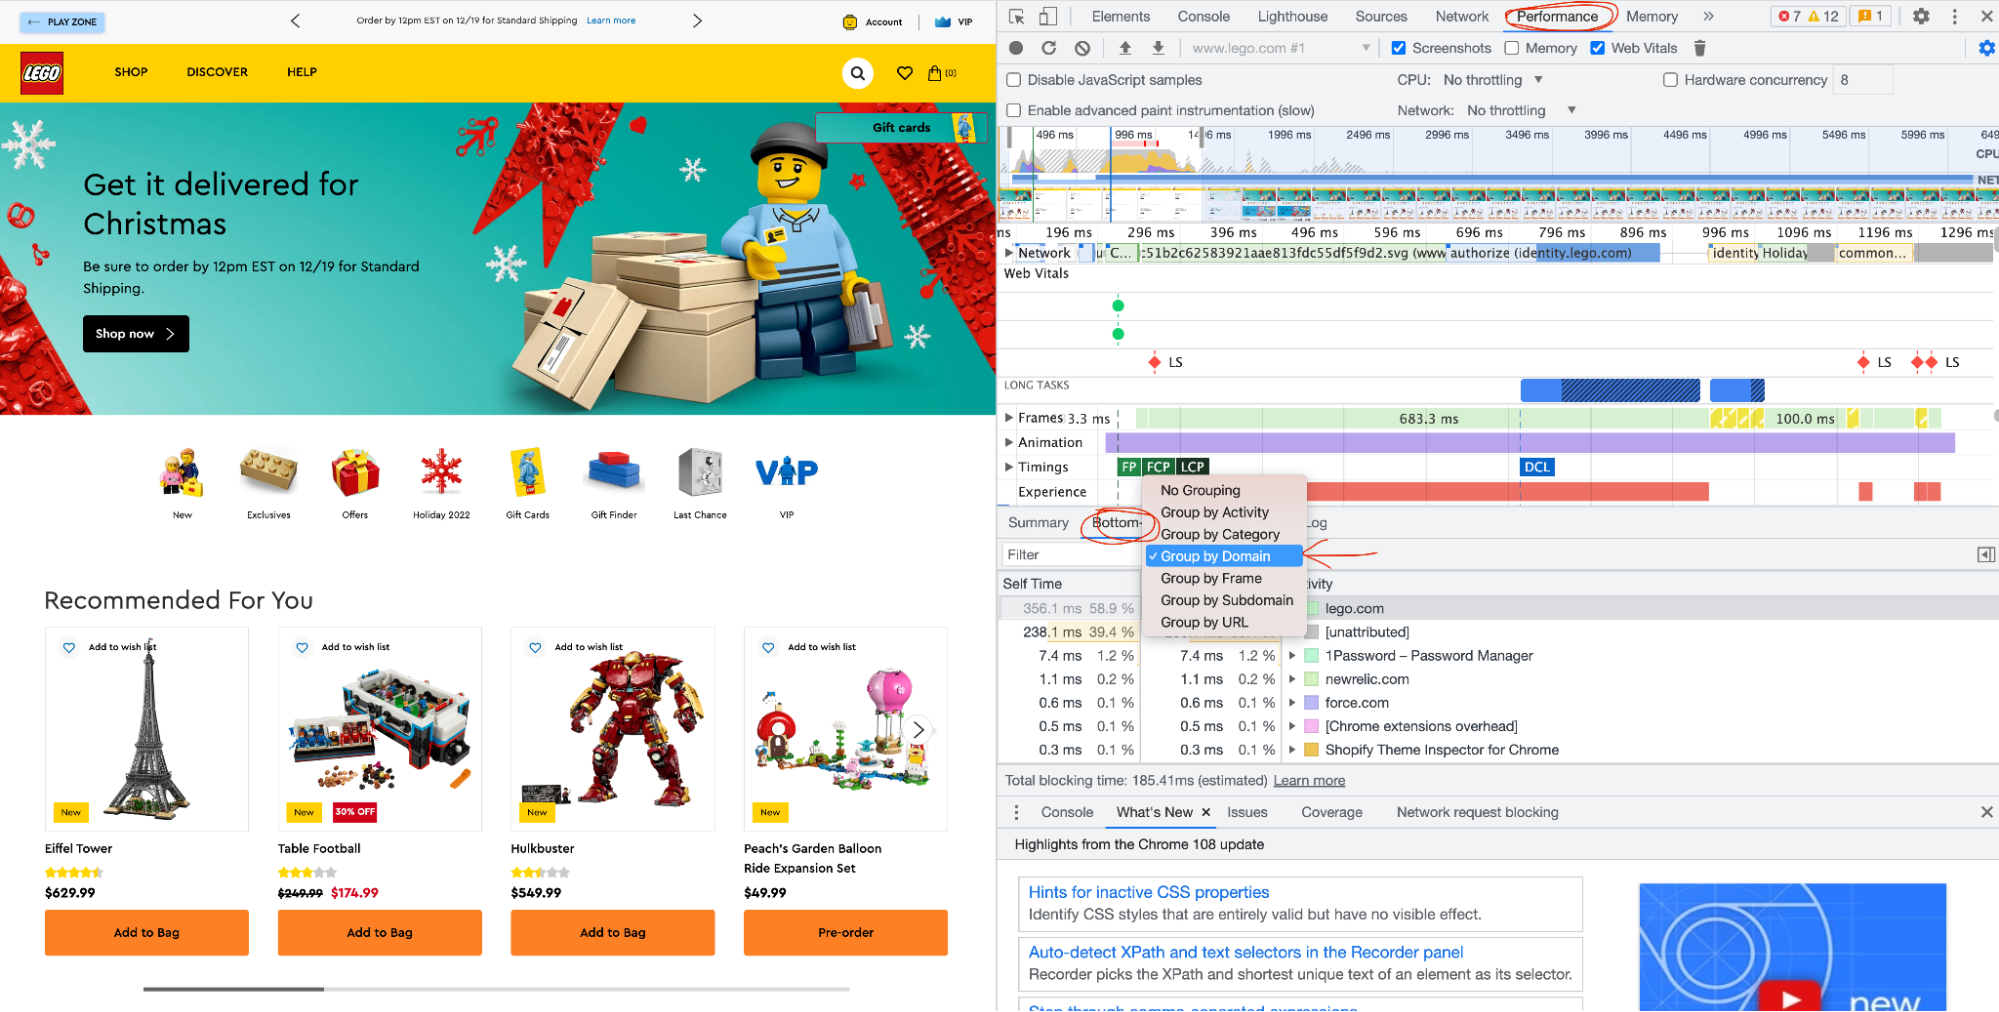
Lighthouse Treemap is great for looking at the relative sizes of scripts in terms of bytes. However, that doesn’t always translate to a main thread impact on load. So when I’m looking at loading performance, or really any sluggish process, my go-to tool is the Performance Tab in Chrome Dev Tools.
What’s especially cool, is the Bottoms-up view in the panel above the “drawer” (“subdrawer”?). By selecting Group by Domain, I can find which scripts, especially third parties, are using up the processing time the most. The caveat here is that not every process is equal, so still check out the long tasks in the profile. Also, I purposely did the test above in my main browser with all my extensions so that you can learn from my bad behavior and only run this on a profile without Chrome extensions.
P.S. You’re welcome to send me that LEGO Eiffel Tower for Christmas.
#2: The Chrome User Experience Report through TREO’s sitespeed tool
Often, when I work with merchants or clients, they are worried about their Lighthouse scores. So I have to do a bit of training on the difference between Lighthouse and how real users experience their site. Also, I have to explain that the data fed into Google’s search engine rankings is not from Lighthouse but the Chrome User Experience Report, or CrUX for short.
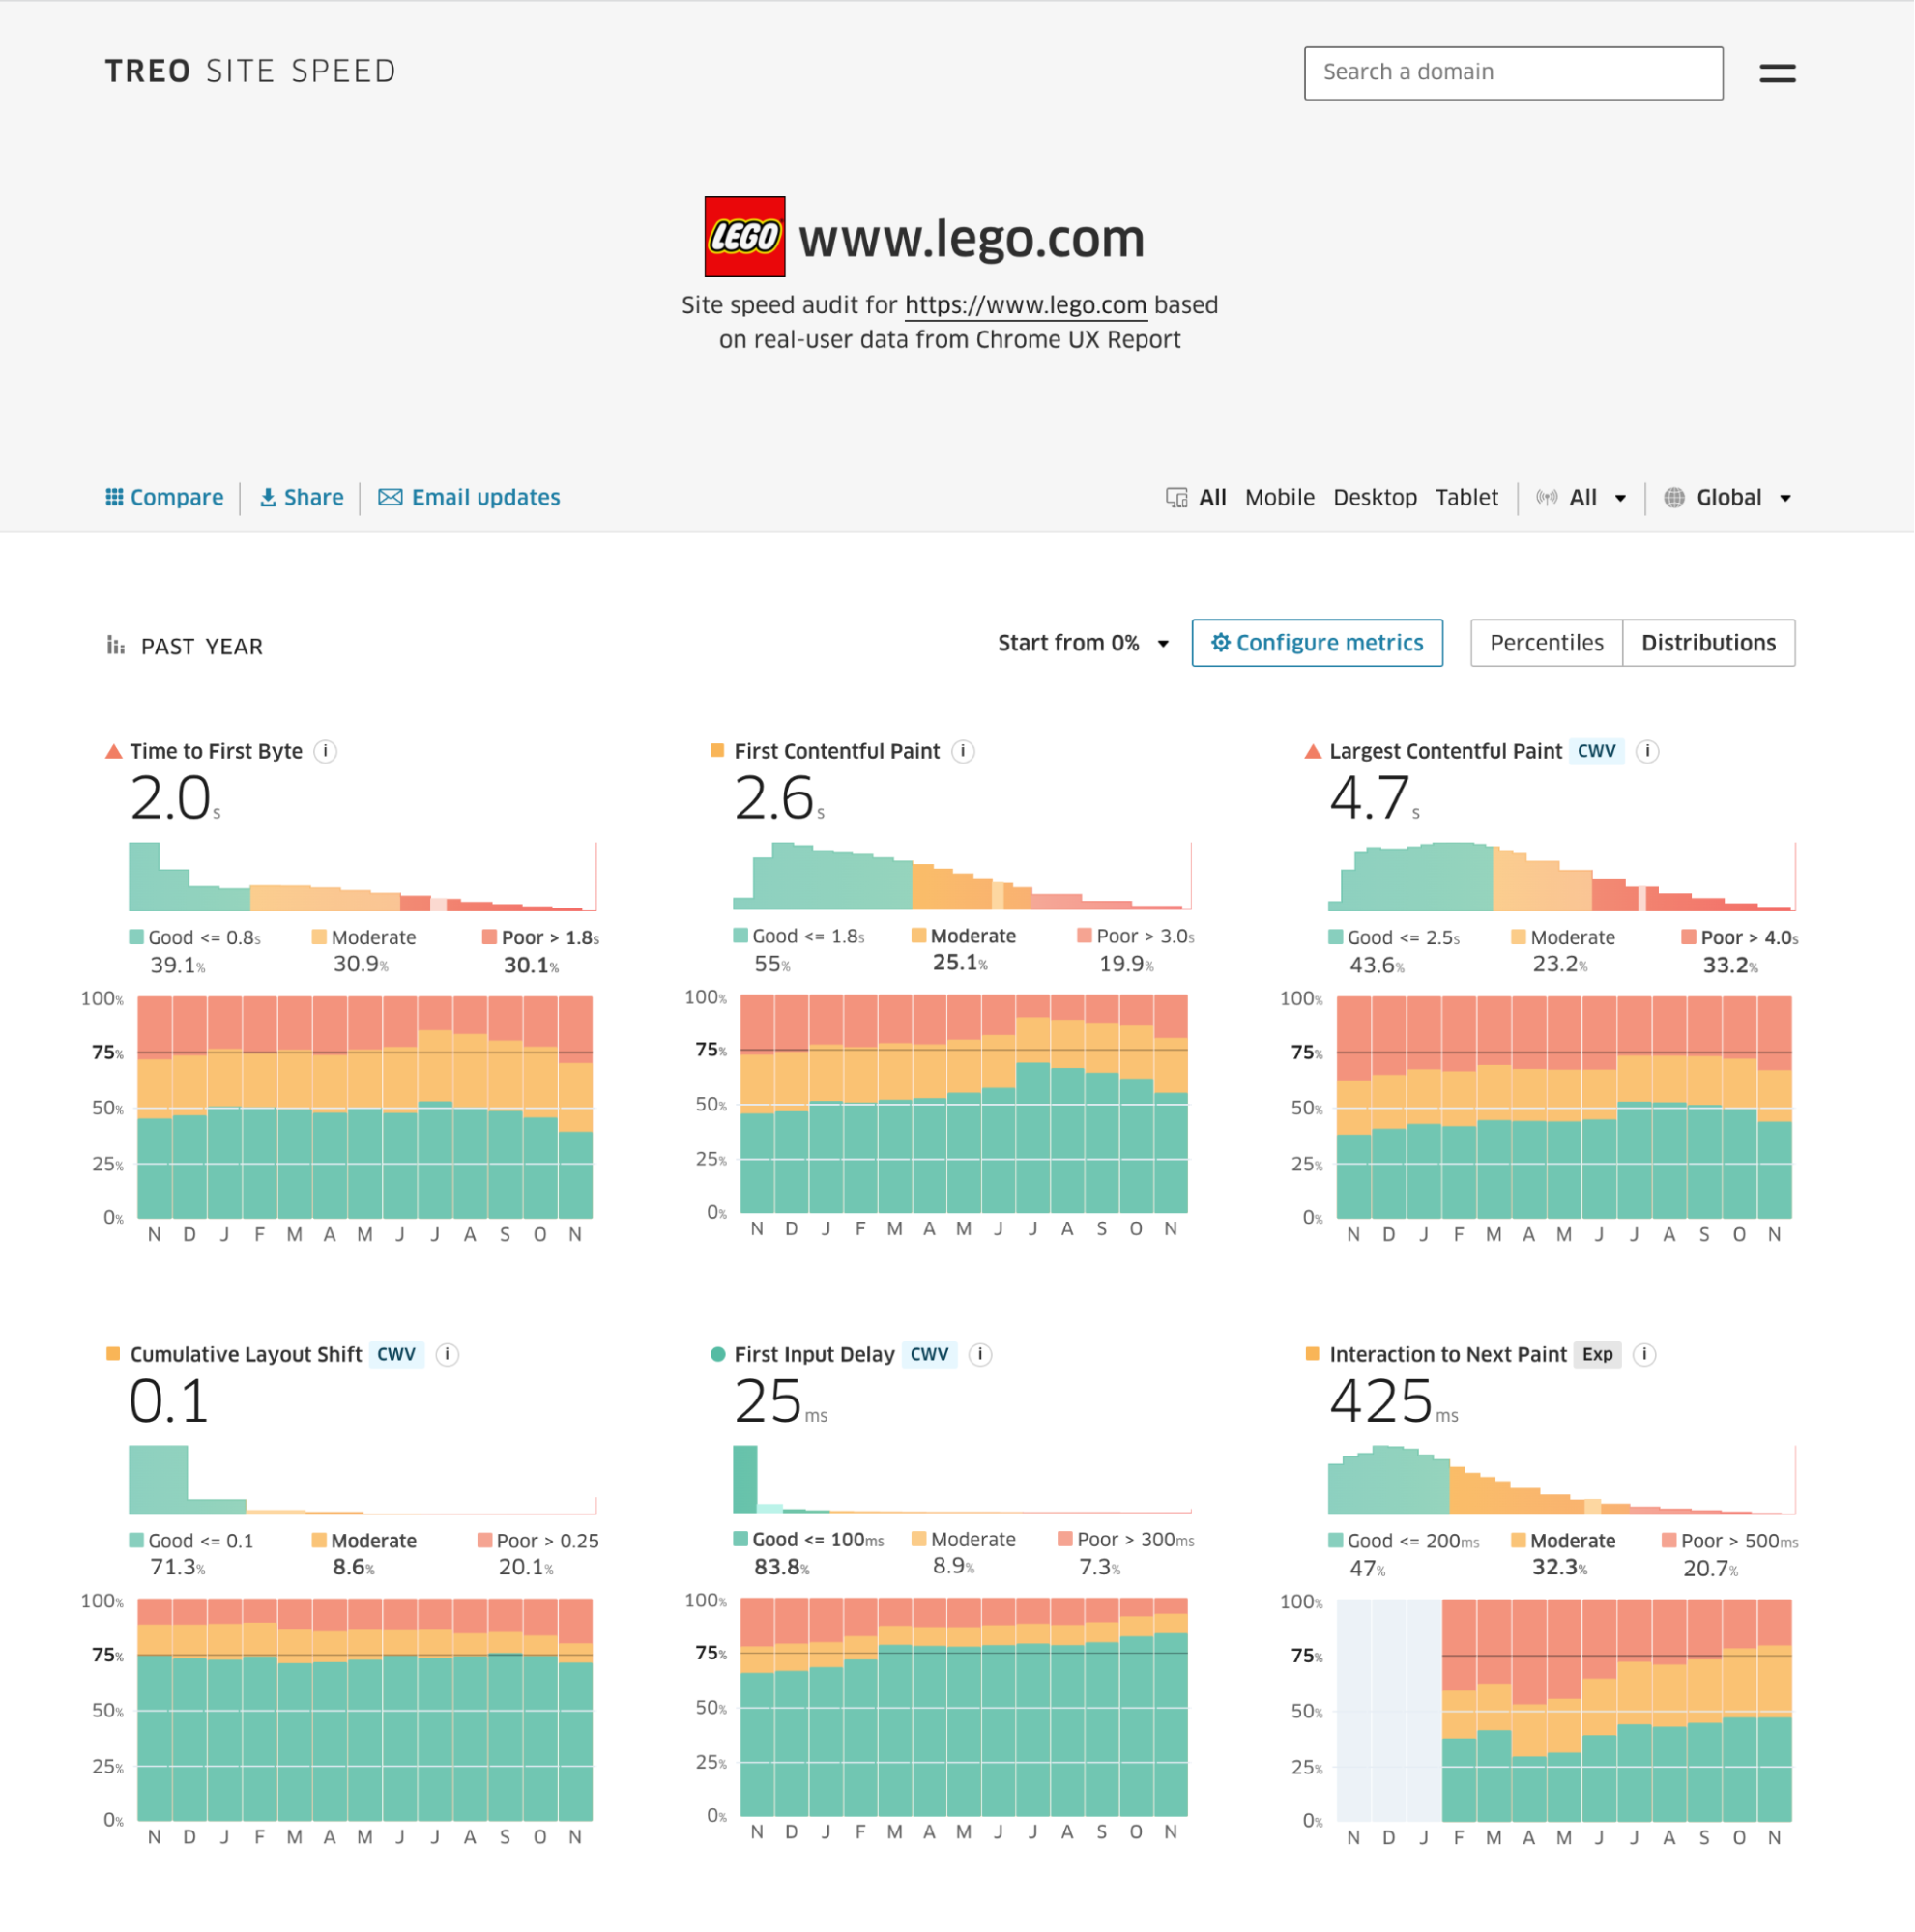
CrUX is a publicly-available dataset that represents the real user performance data on Chrome for users that opt in to sharing data. If your site has enough traffic, I can see how it’s performing at least for Chrome users.
You can access this data in many different ways, but I love TREO’s sitespeed tool because it can fetch the data very quickly from the API. I also really like looking at the distribution view for the charts. I can quickly pinpoint which metrics for performance are the worst offenders for an origin (domain). It’s best to have more detailed information by URL or page type, but this is an excellent way to get at least some data.
And now, drumroll please…
#1: WebPageTest

WebPageTest, how do I love thee? Let me count the ways.
Alas, I cannot count because WebPageTest is invaluable to me. I cannot even decide which screenshot to use because so many parts of this tool are excellent. For example, I can share my test run I did for the LEGO site. In the screenshot above, I see metrics for the median run (you can run up to 9!) as well as data from the CrUX API, if available. Then we can see the waterfalls for each individual run.
My favorite view after that is the FilmStrip View. As you scroll back and forth, the red line moves in the waterfall.
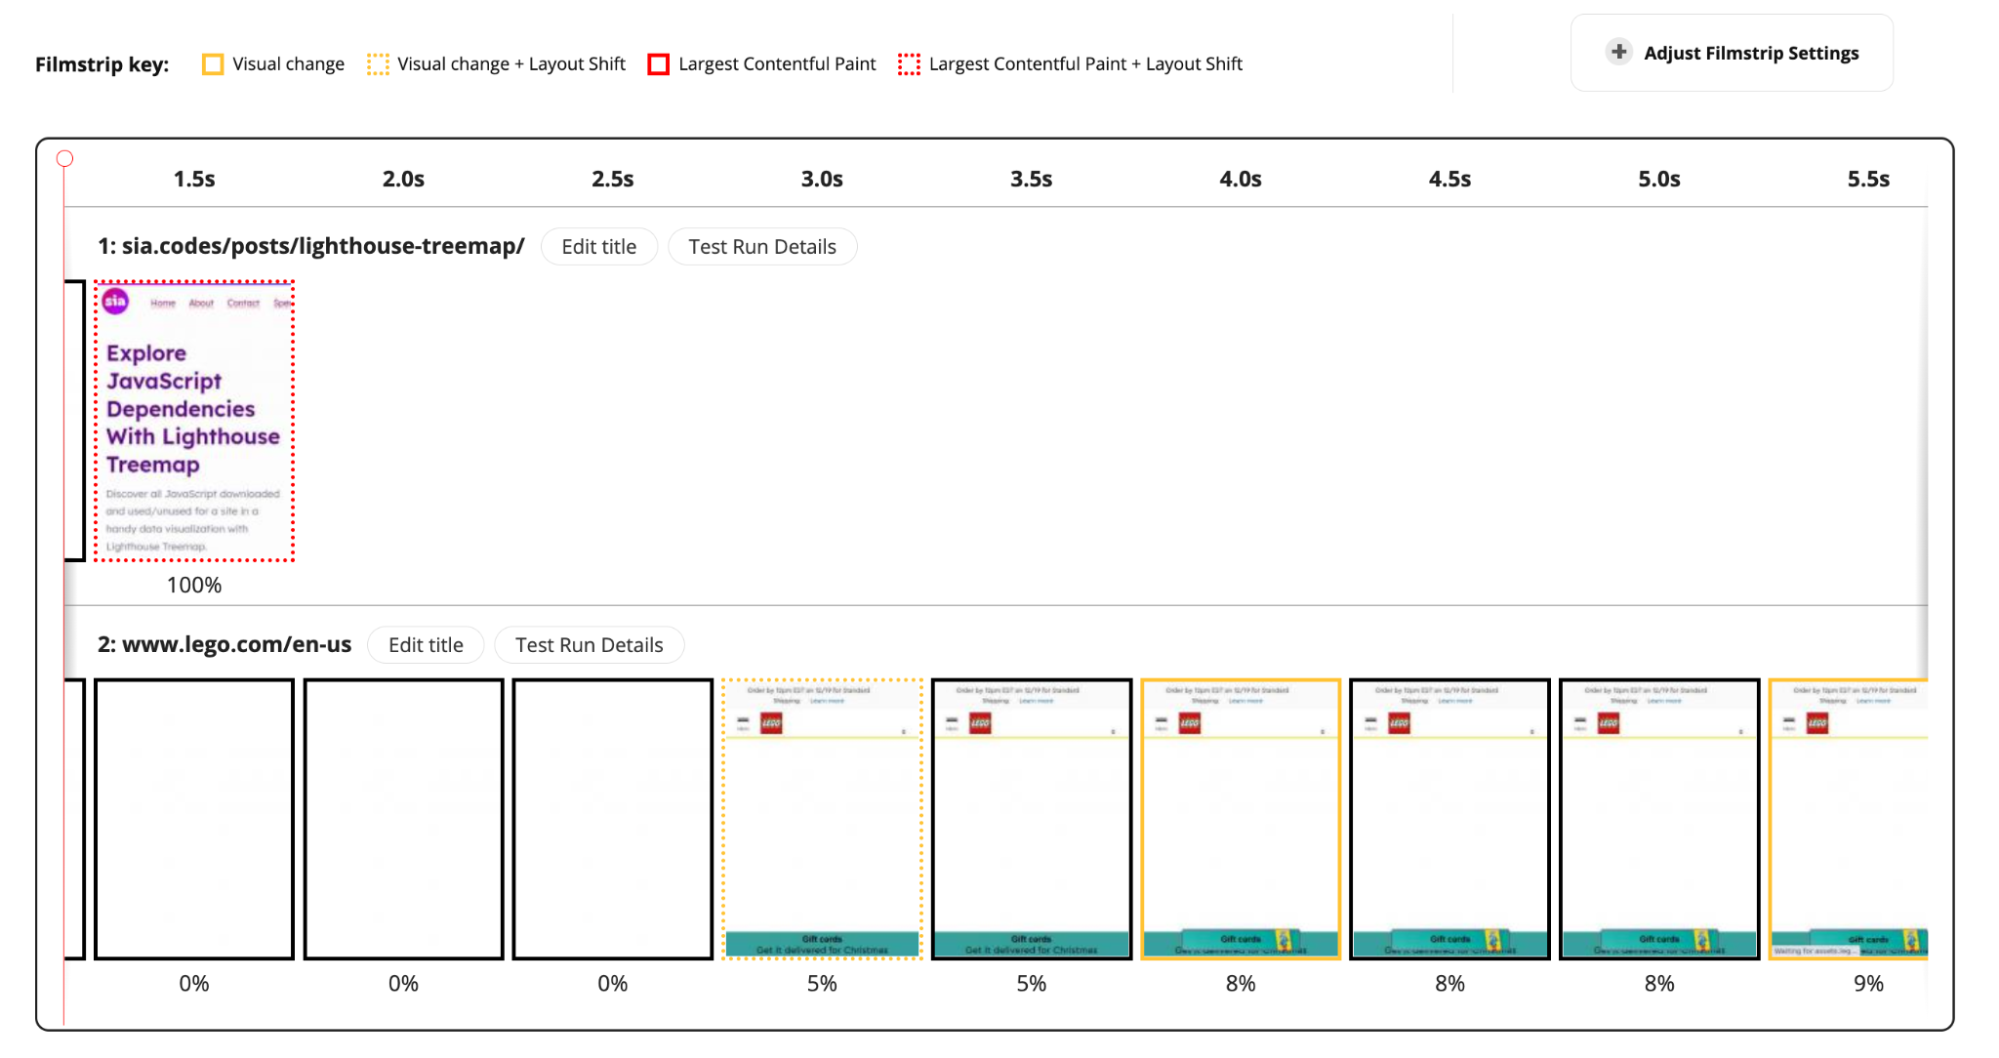
After that, my next favorite view is the Web Vitals one that gives you more data about LCP, CLS, and TBT (as a proxy for FID). If you upgrade to Pro, you can also run Experiments, which is a killer feature for using web workers to modify the site code and test if it would make an improvement before spending hours trying to implement it yourself. Finally, and perhaps most importantly, you can compare tests against each other and create nifty comparison videos (click “Adjust Filmstrip Settings” in the top right to get the video).
Only 5 tools?!?!
I know, I know! I use many more, but I had to keep the article shorter than a textbook so that you would still read it!
These are only my top tools for exploring a website from the outside in. I’d love to hear more about your top tools and how they help you in the context of your work.