

Henry Price is a Senior Technical SEO Lead with a passion for making websites perform better. He puts users first and loves figuring out how data can enhance both SEO and web performance strategies. He enjoys making sense of complicated stuff to help websites attract more visitors and keep them happy.
Web Performance Data Explained
Web performance data is essential for both auditing a website and demonstrating the positive impacts of our optimisation efforts. While audits present numerous opportunities for change, their full potential can be missed if we don’t effectively communicate their importance to stakeholders. This is where the CrUX History API, standing for Chrome User Experience Report, is invaluable. This data, sourced from real user interactions worldwide, is a powerful tool for web performance analysis.
As a personal project, I wanted to find ways we can utilise CrUX data further. I’ve developed a simple tool that uses Google’s publicly available history API to integrate with Google Sheets and fetches weekly data. Gathering data through the API is relatively straightforward; the more challenging aspect lies in analysing this data to uncover issues.
Please also read:
Understanding the CrUX History API
What is the CrUX History API?
Launched in February 2023, the CrUX History API revolutionised access to CrUX data. Previously, CrUX data was accessible through platforms like Google Search Console and BigQuery, but these sources had limitations, such as providing only a snapshot or aggregated monthly data. The CrUX API overcomes these limitations by offering daily data, although it initially lacks historical depth, making long-term analysis challenging. Lack of historical data prevents studying regression overtime.
This API enables web performance analysts to gather weekly, URL-specific data, critical for stakeholders focusing on specific website sections (e.g., product pages, news articles). These detailed insights can refine engagement metrics and align them with revenue data. Key CWV metrics provided include Time to First Byte, First Contentful Paint, Largest Contentful Paint, Interaction to Next Paint, and Cumulative Layout Shift.
Using the CrUX History API to Monitor Performance Over Time
The API is a weekly monitoring tool for website owners and analysts. It offers a comprehensive view of website performance over time, aiding in identifying and addressing issues. The API’s integration with various javascript and python models enhances its utility.
Applications of the API include tracking performance trends, identifying specific performance issues, benchmarking against competitors, and creating visualisations and reports. These capabilities make the CrUX API a critical tool for improving website performance.
How to Use the CrUX API for Website Optimization
The CrUX API’s data on Core Web Vitals is instrumental in pinpointing optimization areas. By tracking trends and comparing pre-and post-optimization performance, you can gauge the impact of your changes. Identifying poorly performing pages or elements and taking corrective actions are key strategies for website enhancement.
Using the CrUX API effectively involves starting with a baseline data collection, monitoring trends, focusing on underperforming areas, and implementing performance-enhancing measures. This approach can significantly improve website responsiveness and user experience.
Getting Your CrUX API Key: The Basics
Before exploring the functionalities of how to fetch the data, let’s discuss obtaining the API key. Although straightforward, those needing detailed guidance can refer to the official documentation.
The process involves creating a project on Google Cloud Platform https://cloud.google.com/, activating the CrUX API within your project, and generating your API key. This key is crucial for all subsequent API interactions. For a comprehensive guide, including visual aids, the official CrUX API documentation is recommended.
Crafting API requests is the next step after acquiring your API key. While this guide won’t delve into specifics, the CrUX API documentation provides detailed instructions.
A typical API request looks something like this:
- https://chromeuxreport.googleapis.com/v1/records:queryHistoryRecord?key=YOUR_API_KEY
Simply replace ‘YOUR_API_KEY’ with the key you obtained. This URL is the basis for your interactions with the API, customizable for your data requirements. We will not go into detail for how this API can be accessed but I highly recommend using the Crux API documentation or Debug Bear’s great instructions on using the API with node JS to create your own script.
Enhancing Your CrUX Experience in Google Sheets
To help users streamline their experience with the CrUX History API and facilitate long-term data storage, I’ve developed a quick tool using Google Apps Script. This solution is ideal for those seeking a user-friendly way to access the CrUX API’s extensive information and combine this data with engagement metrics.
How to Access the Tool?
Link to Google Sheet: CrUX History API – Request Tracker
This CrUX API Request tool, built entirely within Google Sheets, processes the list of URLs you provide in the designated tabs. As shown in the accompanying image, the tool features a user-friendly interface for ease of use.
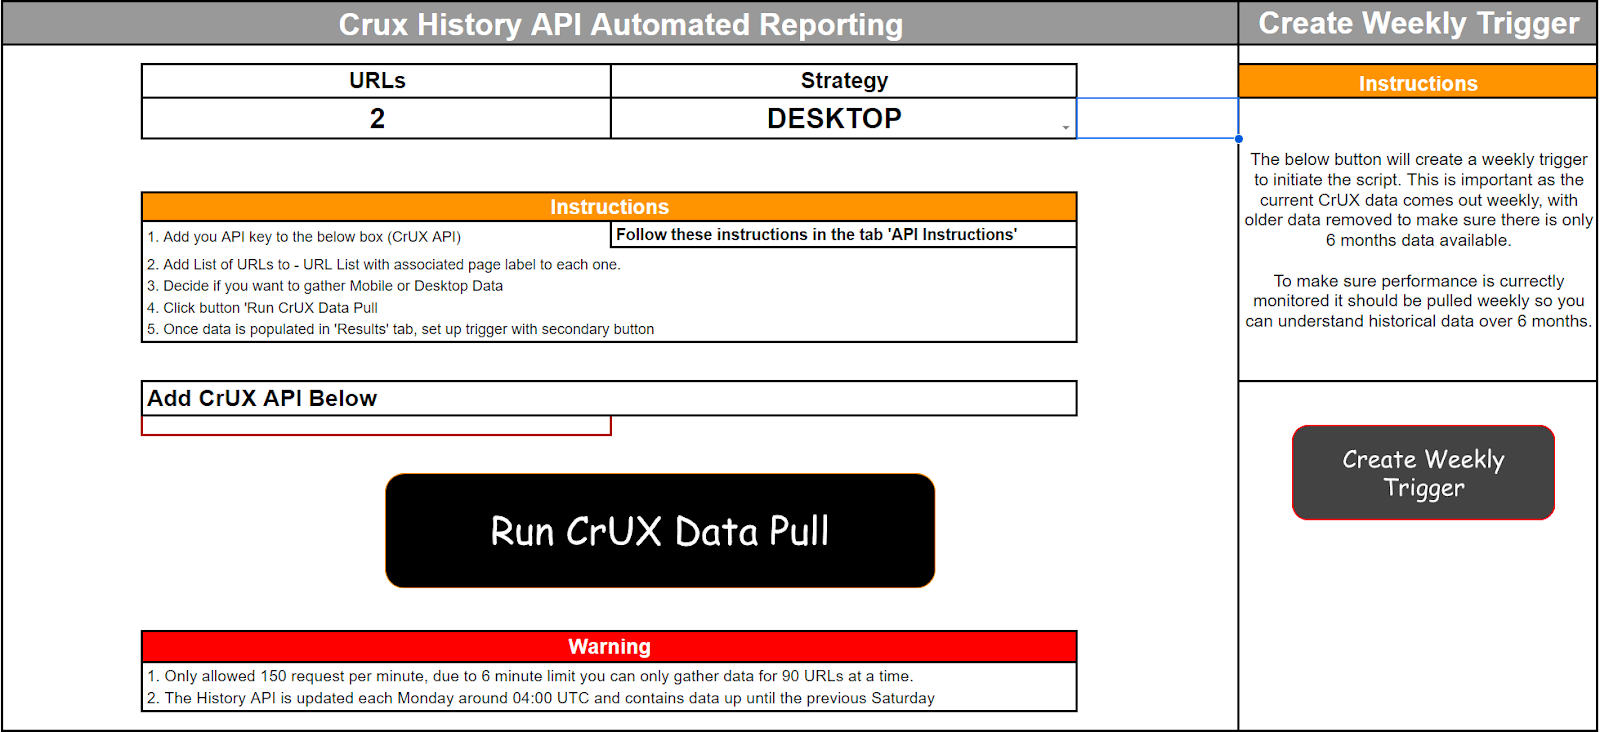
Initiating data extraction is as simple as clicking ‘Run Crux Data Pull.’ The script then processes all URLs from the ‘URLList’ tab, sending up to 15 requests per minute to the history API. The tool automatically detects the number of URLs to test, but you need to specify whether you want to run tests for desktop or mobile. If you want to test both devices, you will need to run the tests separately following the instructions, to prevent an impact to the 6 minute limit on apps script.
Caveats to consider:
- The History API is updated each Monday around 04:00 UTC and contains data up until the previous Saturday.
- All data pulled will be for the last 6 months, duplicated dates may appear but this data can be filtered out if exported.
- Can only test 150 URLs per minute (Sufficient for most sites).
- There is a 6 minute limit on the script if you need to track over the 150 limit per minute.
Adding URLs to Google Sheets
In the ‘URLList’ tab, you should input the URLs you wish to analyse, along with a relevant name for each page type.The script takes a maximum of 900 URLs. Specifying the page type aids future performance reporting, allowing for precise tracking of Core Web Vitals (CWV) improvements or regressions based on implemented changes.

Creating a Weekly Trigger
To analyse ongoing performance as optimizations are implemented, consistent data updates are crucial. Recognising that daily responsibilities can distract us from manual updates, I’ve incorporated automation into the tool. A weekly trigger can be set to activate the script every Tuesday at 9 AM GMT, ensuring that your API data remains current.
Setting this up is effortless–just click ‘Create Weekly Trigger,’ and the tool handles the rest.
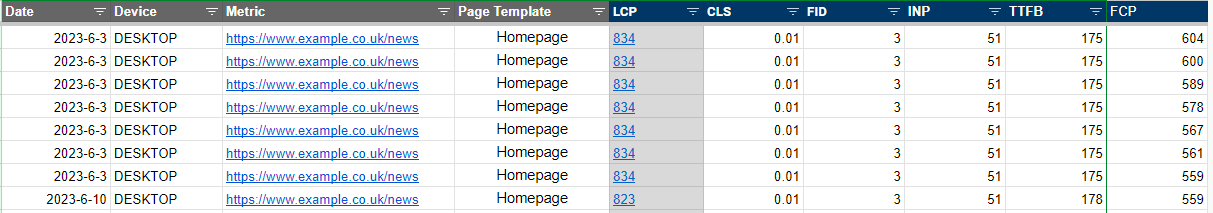
Final output
Once the script completes its run, navigate to the ‘Results’ tab to access your data. Structured to be easily integrated into Looker Studio, the data can also be exported or downloaded for various purposes.
While presenting the data in a PowerPoint is an option, I recommend pushing it to a Looker Studio report. This approach not only provides an automatically updated report but also offers a more visually appealing way to present your findings.
Analysing and Interpreting CrUX Data to create a performance culture
Visualizing performance trends and insights.
After collecting the data, it’s crucial to leverage it for insightful analysis to understand how optimisations may have enhanced performance over time. With the dataset in hand, exporting it to a customised Looker Studio report, like the one illustrated below, becomes a practical next step.

For instance, in the graph showing data for the week of July 10th, we observe a decrease in Time to First Byte (TTFB) correlating with improvements in First Contentful Paint (FCP) and Largest Contentful Paint (LCP). Such insights enable us to cross-reference our change management logs to identify what changes were implemented during this period. Regular monitoring through such reports ensures ongoing vigilance in performance monitoring.
Going further, this data can be combined with engagement metrics to understand how improved CWV metrics affects the user experience overtime for your site.
Monitor regressions ahead of key metric updates
Data is essential not only for reporting back on performance improvements but also for monitoring any adverse impacts, preventing issues from escalating.
With ‘Interaction to Next Paint’ set to become an official Core Web Vitals (CWV) metric in March 2024, benchmarking the last six months’ data for year-over-year analysis is crucial. This strategy helps us identify any potential performance regressions that may occur in the interim.
The industry is actively working to enhance this metric in preparation for the transition. However, over the next three months, any new features incorporated into a site could unexpectedly affect performance, potentially undermining the SEO benefits of improving such a metric.
As an example, if a new feature was added to a site on June 26th, our data might reveal a gradual improvement in performance, thereby enhancing the user experience over time.
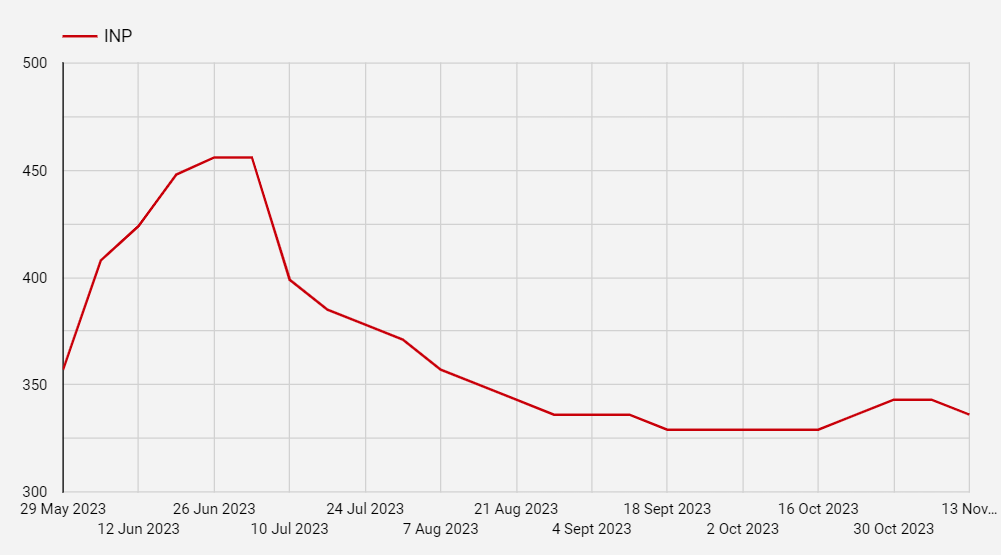
However, there’s a possibility that we might unexpectedly introduce a new feature later on, particularly around October 16th, which could lead to a regression in our positive gains. Prompt attention is vital to avert an increase in INP (Input Delay). The CrUX History API plays a crucial role in quickly identifying the specific template that requires analysis.
This, in turn, facilitates a more comprehensive examination using tools like WebPageTest, Lighthouse, or PageSpeed Insights. By effectively leveraging this data, we can proactively monitor and promptly detect issues, thereby mitigating substantial adverse effects on user experience and revenue.
Conclusion
In summary, the Chrome User Experience (CrUX) History API emerges as an invaluable resource. By offering an extensive dataset, it allows users to deeply understand how real-world Chrome users experience your site. This understanding is pivotal for webmasters, developers, and digital marketers aiming to optimise user experiences and enhance website performance.
I strongly encourage all site speed enthusiasts to use the CrUX History API. Its integration into tools like Google Sheets, complemented by the user-friendly interface of the CrUX API Request tool, makes it accessible even to those with limited coding expertise. The API not only aids in diagnosing performance issues but also in tracking improvements over time, ensuring that your website continually meets the CWV metric thresholds.