

Mateusz Krzeszowiak (@krzksz) loves all things web. He started as a frontend engineer, but his love for measuring the impact in numbers made him focus specifically on performance after a few years. His stubbornness makes him great at debugging and fixing the most mysterious, mind-boggling issues. He currently works at Shopify, where he helps make ecommerce faster for everyone.
In his free time, you'll find Mateusz indoor climbing, playing PC games, or listening to vinyl records.
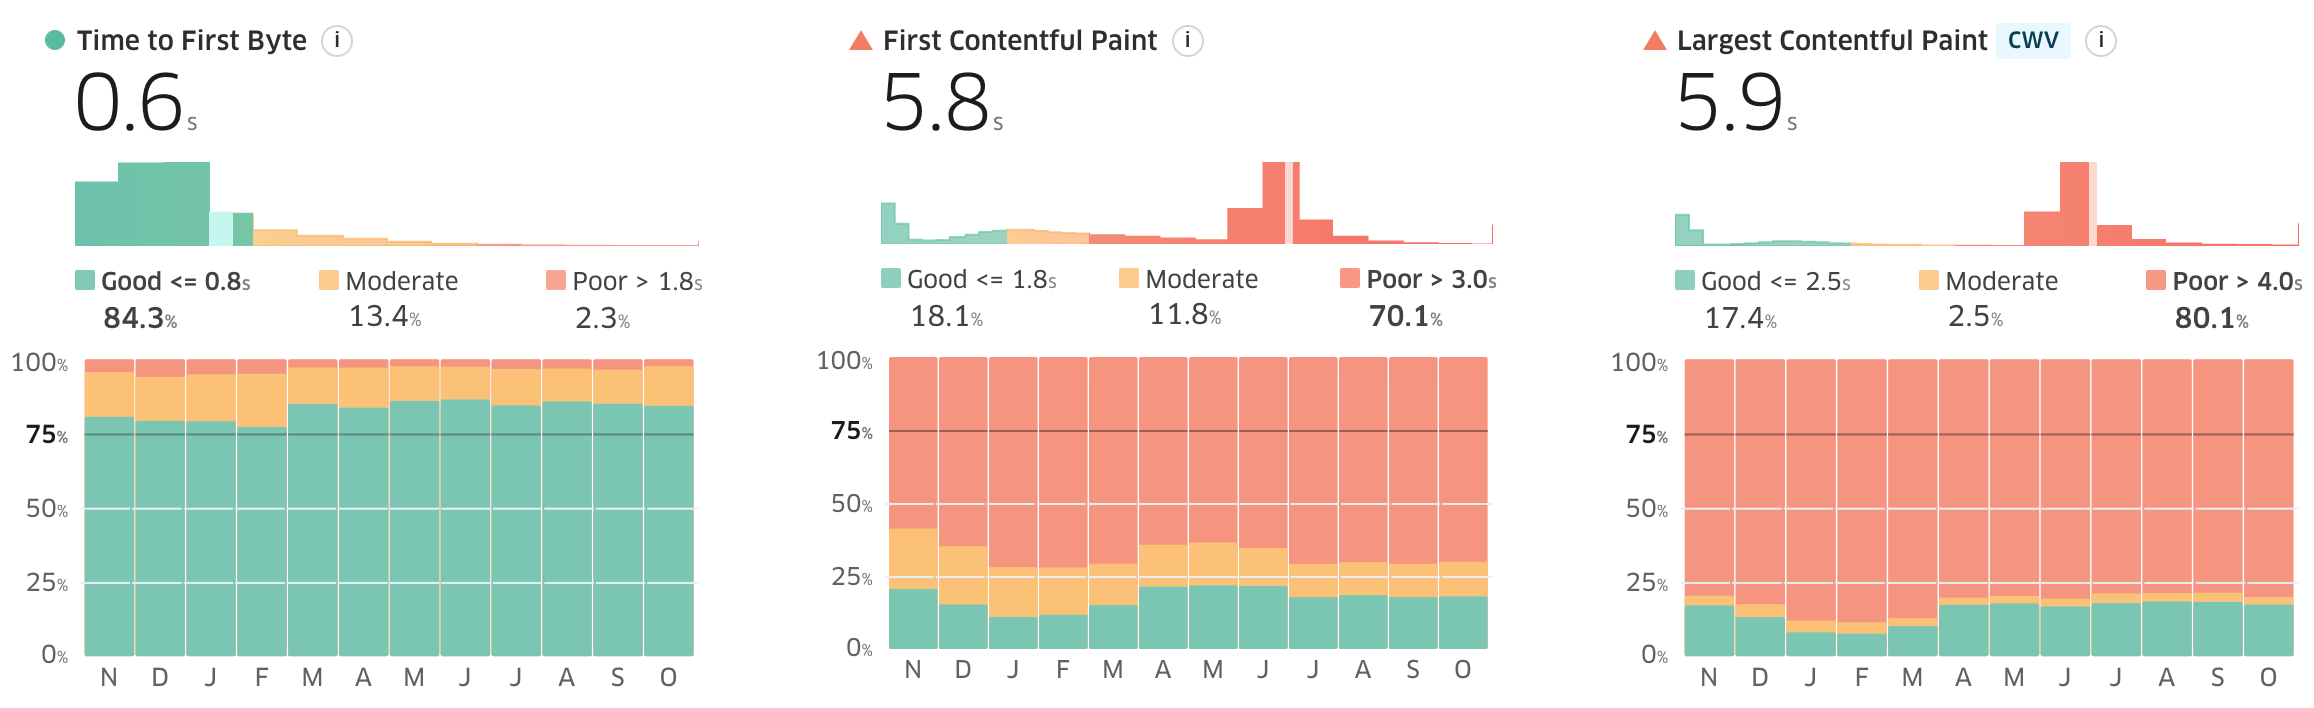
According to Shopify data, Largest Contentful Paint is the most impactful performance metric on conversion and bounce rate. And yet, according to the technology report data from November, LCP has the lowest pass rate out of all Core Web Vitals. That’s even including the new Interaction to Next Paint!
In theory, the Largest Contentful Paint sounds simple to measure and optimize, but the reality suggests the opposite. In this post, I look at some lesser-known quirks of this metric that may lead to unexpected issues. They are not that obvious and can hold you back from moving the needle.
The page needs to actually render first
Let’s start with the simplest definition:
Largest Contentful Paint (LCP) is a […] load metric which describes the speed of delivering the largest contentful element to the screen.
One of its consequences is that the browser has to actually render the content. In other words, Largest Contentful Paint will never be lower than First Contentful Paint.
Above you can see an example, where the slow first render is actually the main blocker. It doesn’t have to be that extreme though. There will always be a group of users, for whom the largest element appears right at the initial paint. This is especially true for repeated views, powerful devices, and fast networks.
There are a lot of ways to make the page render faster, and you should focus on them first. That said, there is one case that I often see, which frustrates website owners and developers.
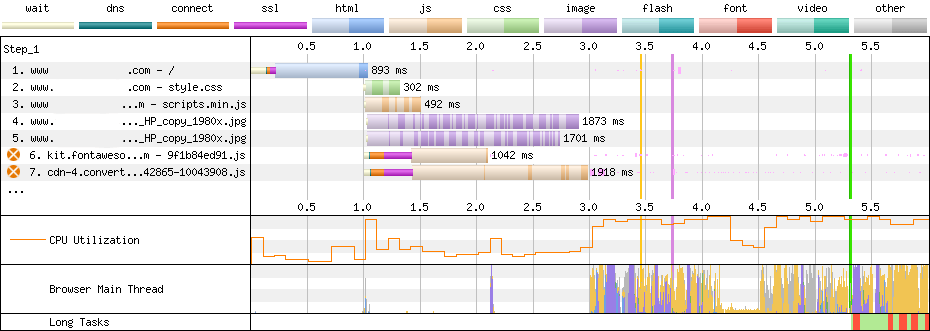
Above, you can see a part of the request waterfall from WebPageTest. There are a few important things to notice:
- The browser starts parsing the HTML at around 1s. It is also when other resources get discovered.
- Image requests (4. and 5.) are preloaded, and one of them will end up as the biggest element. They become ready around the 3s mark.
- The last render-blocking resource (7.) also finishes downloading at around 3s. It also executes quickly.
Judging by this analysis, both First and Largest Contentful Paint should be happening soon after the 3s milestone, but they take over 2s longer. Why? Well, because the page forced them to.
Deliberately delayed rendering
The above situation is caused by something I would call the “paint when ready” pattern. In this particular case, we can see the most popular flavor of it – the anti-flicker snippet. The idea revolves around making the content wrapper transparent. Then, there is some JavaScript logic that makes it visible after a specific condition is met.
I have seen many reasons why such things get implemented. Usually, it is to prevent the layout shifts caused by the dynamic content inserted into the page. This applies to A/B testing and personalisation platforms as well as client-side rendering in general.
There are also some extremes. I’ve seen developers faithfully following Lighthouse’s suggestion to “Eliminate render-blocking resources”. As a result, they marked all styles and scripts as non-blocking. This made the content an unstable mess so it got hidden under the transparency carpet until everything loaded.
To reiterate, you need to make sure that the browser can show the content as early as possible. It limits how fast the Largest Contentful Paint can be. There usually are some resources required to properly show the critical part of the page. Don’t try to be smarter than the browser, just make them render-blocking.
Only the initial size matters (or does it?)
Diving back into the Largest Contentful Paint explainer we’re now going to focus on this particular part:
[…] LCP uses the size of the first paint of elements to decide which one is the largest._
It may not sound like much, but the fact that only the initial size is considered has huge consequences. It’s normal to see changes in layout and element dimensions during the page load. Without this clever assumption, every one of them could result in a new LCP timing.
Sadly, there are some real-world cases where this rule is broken.
Same image, different place
The internet is full of JavaScript-based banners, sliders, and galleries. To make sure they are performant, their initial HTML and styling are usually provided in the main server response. That way, the browser doesn’t have to wait for scripts to download and execute before fetching and rendering the images.
When the script executes, it enhances the component to add functionality like navigation buttons or automatic scrolling. To achieve this, it often has to add extra containers and move the images around in the DOM. Changing the element hierarchy is not an issue, as long as everything appears stable to the user.
Sadly, this doesn’t seem to be the case for the metric itself. Let’s revisit the (slightly modified) first paint example. This time, the image is wrapped with an additional <div> before its size changes:
Surprisingly, the new candidate with a higher load time is reported! Both of them refer to the very same element so why was it even considered? As it turns out, any change to the image placement in the DOM makes the browser “forget” it. Interestingly, this behavior is consistent between Chrome and Firefox Nightly, which recently added support for the Largest Contentful Paint.
In practice, it means that any layout shift may lead to a delayed LCP on pages that use progressively enhanced galleries and sliders. Making sure that only the initial size matters was a good design decision. It may be worth improving this algorithm in the browsers to better detect duplicate candidates.
Monitor until interaction
Looking for the LCP candidate happens until the user starts interacting with the page or closes it completely. It was yet another mindful design decision. It means pages don’t get penalized by content changes being a result of late clicking, scrolling, typing, etc.
Sadly, it also introduces yet another area we need to check. Any late-appearing element (e.g. cookie modal or promotional banner) can hijack the metric with its contents. This is the simpler aspect of it, but it’s sometimes overlooked. Especially when those components appear only for specific user groups.
The combination of both problems
All of this leads us to the situation that was the reason I decided to write this post. There was a particular Shopify store I was helping to optimize. Slow rendering was the main issue, so we kept shipping more and more improvements to address it. We were also monitoring the real user performance data throughout this work.
Unfortunately, our changes stopped moving the needle on product pages at some point. It was even more problematic because product and collection pages are responsible for the majority of traffic. Their impact on the overall experience is always high, so I had to investigate.
Document modifications and layout shifts
Analyzing the performance data suggested that the Largest Contentful Paint is higher for at least 25% of visitors. It was a situation that I hadn’t been able to reproduce for a long time.
I was aware that the page uses a cookie banner, but its elements were too small to hijack the metric. What I didn’t know was that there were multiple variants of it shown to the users. One of them included a standard modal covering the entire page. With this version, I was finally able to get the slower LCP.
It’s a common practice for modals to come with styling that prevents the rest of the page from scrolling. There are multiple techniques to do it, but the common side-effect is that the vertical scrollbar disappears.
This is where the mystery untangles. Hiding the scrollbar makes the viewport wider, but only for users:
- On desktop devices.
- Who have the bar configured to automatically appear in their OS settings.
- With screens that are narrow enough to limit the content.
As a result, the gallery image becomes wider. It was also wrapped with an extra container by JavaScript after the initial render. This all means that the new candidate gets reported with a bigger size and a higher load time.
The solution? Apply some scrollbar-gutter: stable to the page, done. It was a simple one-line fix that required weeks of investigation and debugging.
Summary
Tracking the appearance of the biggest element may sound trivial at first, but it actually is quite complicated. Still, it’s a crucial metric to have as it aims to reflect the real user experience. Besides, some of the rough edges may even be resolved by the browsers in the future. If not, I hope this article helps others address the quirks I talked about above.
The case I covered here also made me pay more attention to the Cumulative Layout Shift. I always aimed to get the lowest score possible, but I didn’t know even the slightest instability could have so much impact.
Lastly, this is yet another lesson that our experience may not reflect what others get. We want to make our pages faster for everyone. It requires us to learn the different groups and variants our visitors get divided into. Without this knowledge, we’re limiting the impact of our work, which is frustrating at best and wasteful at worst.