

In the 2011 Performance Advent Calendar, Alois Reitbauer introduced us to Resource Timing but at that point no browser supported it. One year later and it’s supported in Internet Explorer 10, and Chromium nightly builds so we finally have something to play with.
Real User Monitoring (RUM) allows us to build a picture of how long our pages take to load in an actual visitor’s browser, chart the times and look for patterns, but what if we want to dig further? What if we want to get a better understanding of why some of our outliers are slow, or want to monitor the load time of a third-party component?
If we’re lucky perhaps there’s a WebPagetest instance close to our visitor or we have other synthetic monitoring tools that we can use to get some indications but wouldn’t it be great if we could reach into the visitor’s browser, get timing information on an individual resource level and send it back into our RUM tools?
Perhaps we’re on a tablet or other device without easily accessible developer tools and we want to capture the page load waterfall then send it to HAR Storage, or Jdrop for later analysis.
Resource Timing offers us exactly that; a way to gather timings for each individual resource on the page in the browser.
Resource Timing
To explore Resource Timing, you’ll either need a copy of IE10 or a nightly Chromium build (methods are still vendor prefixed in the Chromium builds).
Resource Timing extends the W3C performance timeline and is accessible via the window.performance interface.
window.performance.getEntriesByType("resource") returns a list of PerformanceResourceTiming objects in startTime order. (Navigation Timing is still required for page level timings as the list returned only contains data on resources.)
Opening http://www.bbc.co.uk/ and examining the sixth resource:
window.performance.getEntriesByType("resource")[5]

window.performance.webkitGetEntriesByType("resource")[5] in Chromium
Produces an entry that looks like:
connectEnd: 156.67599995806813
connectStart: 156.67599995806813
domainLookupEnd: 152.7639999985695
domainLookupStart: 152.7639999985695
duration: 113.7309999903664
entryType: "resource"
fetchStart: 152.7639999985695
initiatorType: "script"
name: "http://www.bbc.co.uk/survey/pulse/conf.js"
redirectEnd: 0
redirectStart: 0
requestStart: 158.67599995806813
responseEnd: 266.4949999889359
responseStart: 264.67599995806813
secureConnectionStart: 0
startTime: 152.7639999985695
The timings are DOMHighResTimeStamps, and measure time elapsed since the Navigation Timing navigationStart attribute. They map to the following phases of the request and response:
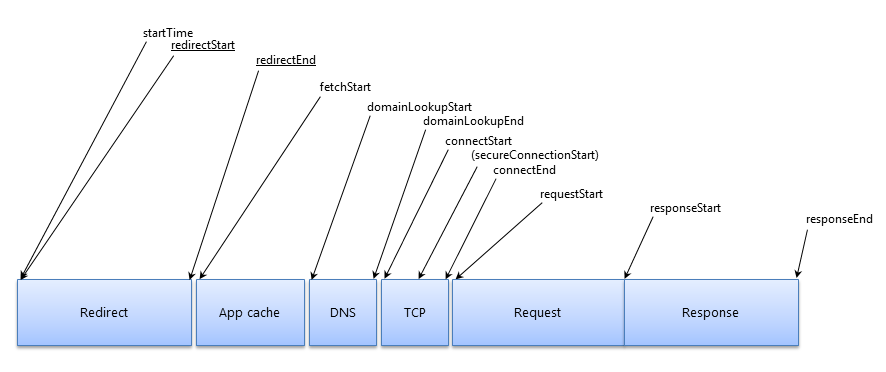
There are some other methods that might be useful when using Resource Timing: getEntriesByName allows us to retrieve entries by their URL, and there are methods for managing the buffer of Resource Timing entries: clearResourceTimings and setResourceTimingBufferSize.
The buffer should store at least 150 entries, and will fire onresourcetimingbufferfull when full.
There’s a separate buffer for each document, so if a page contains an iframe, the iframe has it’s own set of resource timings. The request for the iframe is included in the parent’s list of resources, and resources loaded by the iframe are included within its own list of resources.
Third Party Resources
For privacy, only limited timing information is available for resources loaded from other hostnames, as using differences in timings might make it possible to determine whether someone is, for example, logged into a social network.
BBC News shards its resources across multiple hostnames, and as the first resource is retrieved from a different hostname it only has timings for startTime, fetchTime, duration and responseEnd. All the other times are set to zero.
The example below is from Chromium and has a responseEnd value of zero. This looks like a Chromium bug as responseEnd is not one of the attributes that should set to zero for 3rd party resources and IE10 includes a non-zero value for this resource.
connectEnd: 0
connectStart: 0
domainLookupEnd: 0
domainLookupStart: 0
duration: 340.0260000489652
entryType: "resource"
fetchStart: 132.88499996997416
initiatorType: "link"
name: "http://static.bbci.co.uk/frameworks/[...snip...]/style/main.css"
redirectEnd: 0
redirectStart: 0
requestStart: 0
responseEnd: 0
responseStart: 0
secureConnectionStart: 0
startTime: 132.88499996997416
The Timing-Allow-Origin header allows 3rd parties to expose the timing information to other sites.
The BBC could make timings accessible to other sites by adding Timing-Allow-Origin: * to responses from http://static.bbci.co.uk, or just restrict it to www.bbc.co.uk via Timing-Allow-Origin: www.bbc.co.uk
What can we do with it?
Perhaps the best way to understand an API is to build something with it…
Andrea Trasatti, is already using Resource Timing to create HAR files and has released his code.
Originally I aimed to produce HAR files too but I found gaps between the data Resource Timing provides, and the detail needed to populate a HAR.
Some of the gaps I ran into included: unable to detect if a request suceeded or failed, HAR stores redirects as a separate request, HAR also assumes a continuous timeline and with the advent of DNS pre-fetching timelines can have gaps.
Instead I decided to skip the HAR for now and build a waterfall bookmarklet.
Building a Waterfall
Building the waterfall is split into two phases: first gather the page level times from Navigation Timing and the resource timings from Resource Timing, and then use SVG to visualize them.
To store all timing data together I created an array of objects containing the start and duration of the phases for each request and response pair.
The duration of some phases is easy to calculate, for example:
redirectDuration = redirectEnd - redirectStart
Others like AppCache are more complex. If the AppCache phase exists, it starts at fetchStart but it’s end value might be: domainLookupStart, connectStart or requestStart
You’ll see from the code snippets below I’ve left AppCache and SSL for now and plan to revisit them later.
Page Level Data
Page level timings all come from Navigation Timing and are measured as the number of milliseconds since midnight of January 1, 1970 (UTC), so need to be re-calculated relative to navigationStart.
url: document.location.href,
start: 0,
duration: timing.responseEnd - timing.navigationStart,
redirectStart: timing.redirectStart === 0
  ? 0 : timing.redirectStart - timing.navigationStart,
redirectDuration: timing.redirectEnd - timing.redirectStart,
appCacheStart: 0,
appCacheDuration: 0,
dnsStart: timing.domainLookupStart - timing.navigationStart,
dnsDuration: timing.domainLookupEnd - timing.domainLookupStart,
tcpStart: timing.connectStart - timing.navigationStart,
tcpDuration: timing.connectEnd - timing.connectStart,
sslStart: 0,
sslDuration: 0,
requestStart: timing.requestStart - timing.navigationStart,
requestDuration: timing.responseStart - timing.requestStart,
responseStart: timing.responseStart - timing.navigationStart,
responseDuration: timing.responseEnd - timing.responseStart
Resource Level Data
Resource level timings are retrieved using getEntriesByType and are already relative to navigationStart.
url: resource.name,
start: resource.startTime,
duration: resource.duration,
redirectStart: resource.redirectStart,
redirectDuration: resource.redirectEnd - resource.redirectStart,
appCacheStart: 0,
appCacheDuration: 0,
dnsStart: resource.domainLookupStart,
dnsDuration: resource.domainLookupEnd - resource.domainLookupStart,
tcpStart: resource.connectStart,
tcpDuration: resource.connectEnd - resource.connectStart,
sslStart: 0,
sslDuration: 0,
requestStart: resource.requestStart,
requestDuration: resource.responseStart - resource.requestStart,
responseStart: resource.responseStart,
// ??? - Chromium returns zero for responseEnd for 3rd party URLs, bug?
responseDuration: resource.responseStart == 0
  ? 0 : resource.responseEnd - resource.responseStart
Putting it all together
Once we’ve got an array with all the timing objects, all we need is some SVG to visualise it and we have waterfalls!
The bars use the same colors as WebPageTest, so green is request, blue the response, and brown the TCP connect times.
Both waterfalls below were generated from html5doctor.com.
The first waterfall is from IE10. It has a few oddities such as the response for the initial page request having a zero duration. Also, it’s missing timings when TCP connections are created:
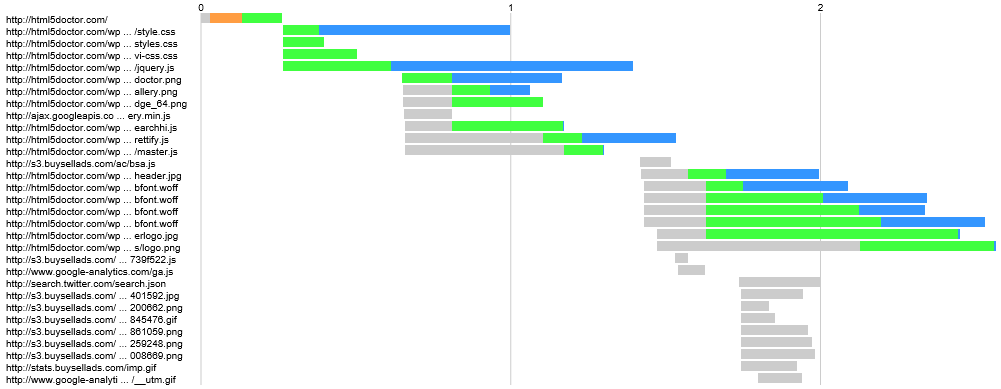
The waterfall in Chromium looks similar but it actually has a response duration for the initial page and the issue with the TCP connection timings is really obvious:

Completely gray bars are resources from other hostnames and so only have minimal timing information. Timing for a resource starts when the browser queues it up for fetching, so the gray at the start of bars is the time a browser is blocked waiting for a connection to become available.
Try it yourself
To try it yourself just drag the link below to your bookmarks, remember you’ll need IE10 or a Chromium nightly build.
The source code for the bookmarklet is up on GitHub – Waterfall – along with a list of things that need to be improved, such as adding the timings from iframes, fixing the TCP, SSL and AppCache timings etc.
Things to make you go Hmm…
Resource Timing is still in its early days. All implementations of the API are in preview or nightly builds of browsers so it’s unsurprising to come across things that don’t behave quite how I’d expected. Some might be bugs, and other things I’d hadn’t considered when reading the spec.
The most surprising limitation is that there’s no easy way to determine if a request succeeded or failed e.g. HTTP 4xx or 5xx, or whether in the case of a 3rd-Party SPOF, the browser timed-out the request.
3rd-Party SPOFs might be recognisable by the length of the request, or the lack of response but if browsers decrease the timeout will these issues become harder to recognise?
Straightforward 4xx and 5xx errors are harder to spot: was the response fast because the resource was delivered quickly or because the server returned an error page? Most of the error pages I see are dynamically generated so there might be a hint in the request duration but I wonder if explicit success and failure indicators would be an improvement.
There’s also some strange behaviours that might be bugs…
In IE10, one of the requests on http://uk.msn.com/ returns about:blank for the name (it’s valid – an iframe without a src is inserted and the src specified later) and handily sometimes window.performance.getEntriesByType is undefined!
Chromium sometimes reports incorrect values for connectStart and connectEnd, e.g. when a new TCP connection is opened they are the same value but different values when a connection is being re-used.
Wrapping Up
Resource Timing looks like it’s going to help us to get an even better understanding of our visitors’ experience. Not only will we be able to measure overall page load times, but we’ll be able to get detail on which resources are having the biggest impact on those load times.
From a RUM perspective it may not be viable to beacon data back for all users, but we will be able to sample or choose to send the data back for just those visitors who are outside our load time goals.
If you’re a 3rd party who provides resources that others embed on their sites, or you shard your content across multiple hostnames, you should start thinking about whether, and when to add the Timing-Allow-Origin header. For sharded content, e.g. CDNs, it’s a pretty easy choice, but for services that people log into, such as social networks, the potential privacy issues need further investigation.
If you want to get involved and improve the prototypes, the code for Andreas’ HAR builder and the code for my waterfall bookmarklet are both on GitHub.
Apple and Opera, Come on in the Water’s Lovely…
We’ve been able to get real page load times for visitors who use IE, Chrome and Firefox via Navigation Timing for quite a while, and now we’re also going to able to get the resource level detail.
It would be really great if we were able to get the same information from people who use Safari and Opera too!
Further Reading
If you want to learn more about Resource Timing, Navigation Timing or any of the other performance timeline specifications you’ll find the following links worth reading:
- Timing the Web, Alois Reitbauer
- A Practical Guide to the Navigation Timing API, Buddy Brewer
- Measuring the speed of resource loading with JavaScript and HTML5, Andrea Trasatti
- Resource Timing (Editor’s Draft, Oct. 18, 2012), W3C
- Performance Timeline (Editor’s Draft, Jun. 27, 2012), W3C
- Navigation Timing (Proposed Recommendation, 26 Jul. 2012), W3C
- DOMHighResTimeStamp (Proposed Recommendation, 23 Oct. 2012), W3C