

Barry Pollard (@tunetheweb) is one of the maintainers of the HTTP Archive. By day he is a Software Developer at an Irish Healthcare company and is fascinated with making the web even better than it already is. He's also the author of HTTP/2 in Action from Manning Publications.
The Core Web Vitals (CWV) were announced in May 2020 and as part of that announcement Google said they would be “evaluating Page experience for a better web”. Crucially that this evaluation would form part of their search ranking algorithm: in short, faster websites would rank higher than equivalent slower websites and get more traffic from Google Search (the primary driver of web traffic for most websites).
We in the web performance community have never been as good at selling the business benefits of web performance as the SEO industry — despite plenty of evidence that web performance does directly impact business performance. Well now we had the whole SEO industry fighting our corner and now businesses would have to take web performance seriously!
That announcement was followed by another in November 2020 with a definitive deadline: you needed to get your site into shipshape by May 2021 (for mobile — desktop is to follow a year later).
So we’ve had the ranking impact of CWV around for about half a year: have we seen an impact? Has Google wielding the big SEO stick made the web faster?
There have been lots of success stories which would suggest that yes it has, but this Christmas Grinch is less convinced…
The case for the positive
I help maintain the HTTP Archive, which is a project that aims to track the state of the web. It does this by running monthly crawls of the web and reporting various facts and figures about what we find. We make the data available in three main ways:
- All the underlying data is available in a public BigQuery dataset that can be queried for those with a bit of SQL knowledge.
- We make various stats available as reports on our website.
- We publish an annual report called the Web Almanac which is a deeper dive into the data by industry experts to see what it’s telling us (the 2021 edition of that has just been released btw, so check that out!).
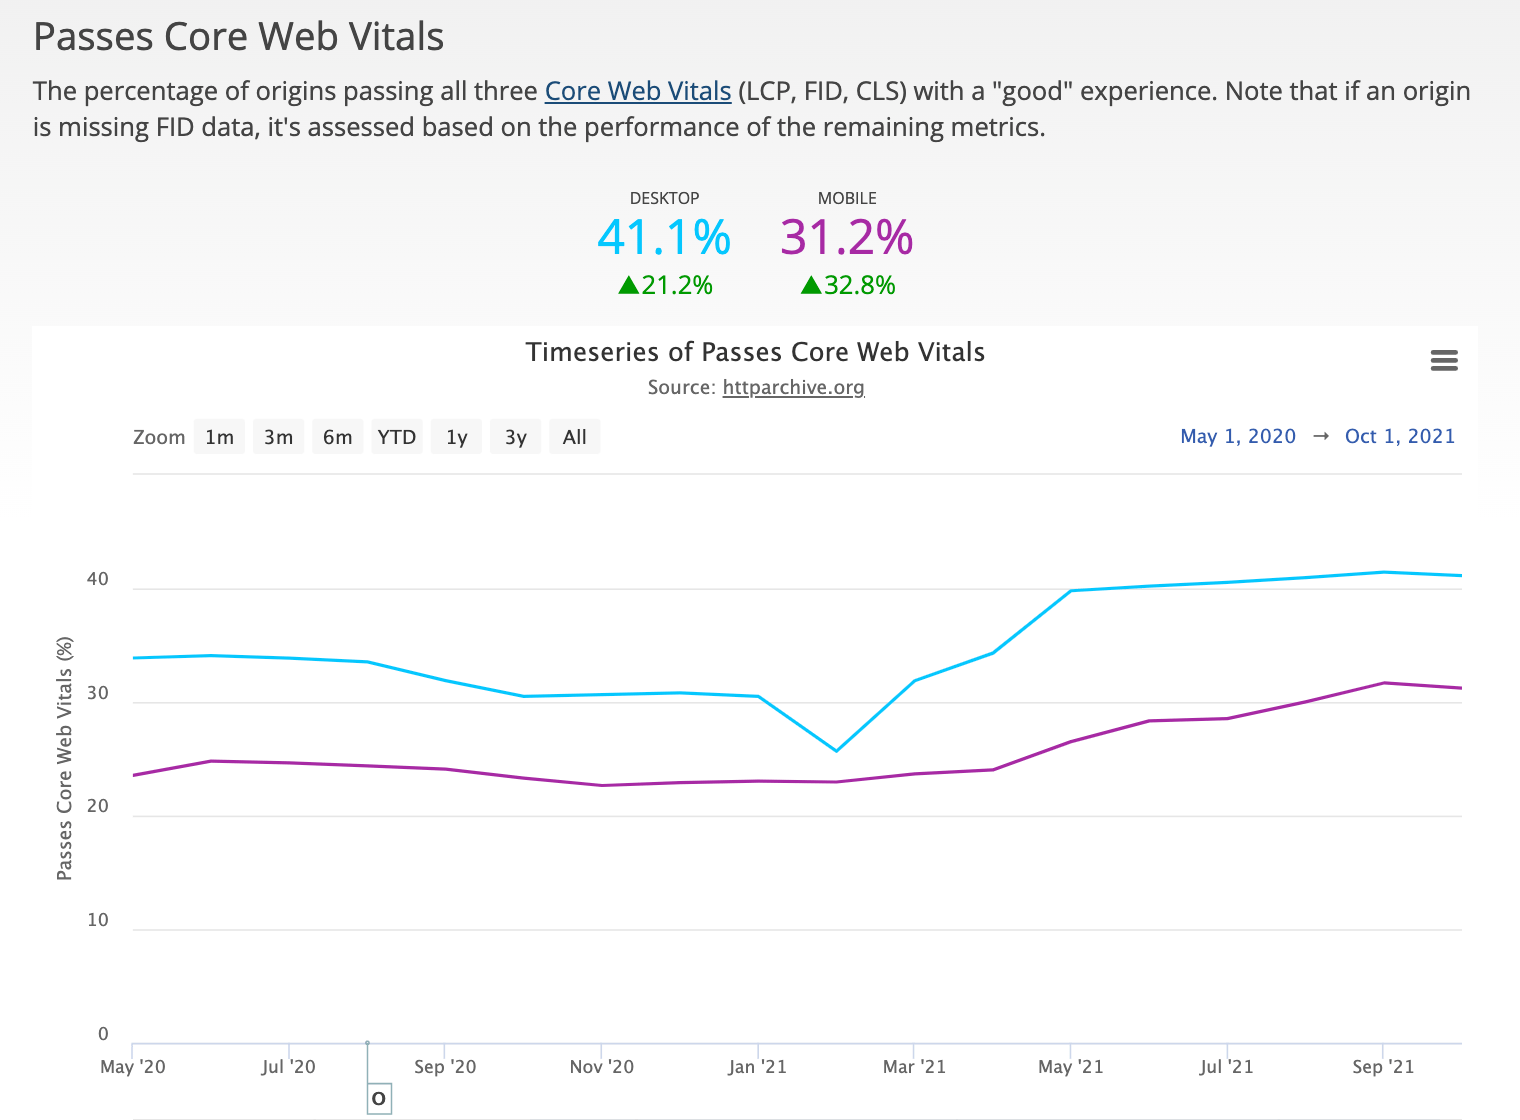
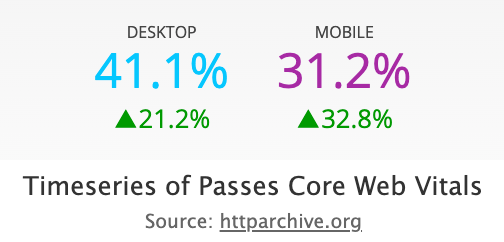
We also link up with the Chrome User Experience Report (CrUX) dataset and use that to help report on even more data. CrUX is how the web vitals are actually reported back to Google and one of those reports clearly shows the number of sites passing Core Web Vitals has increased – particularly since the May 2021 deadline:
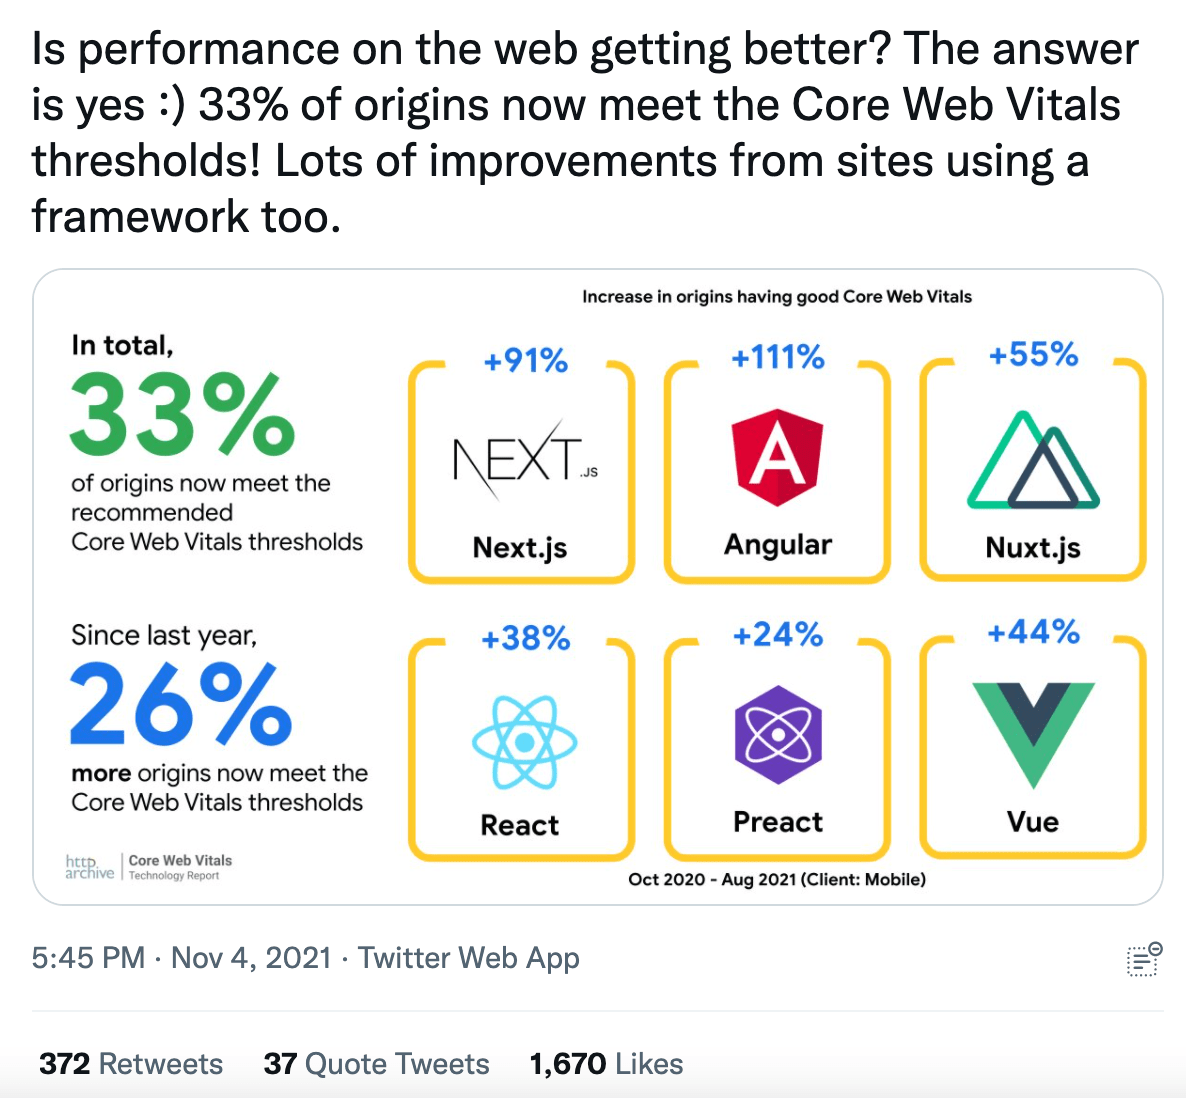
Additionally others (myself included btw!) have shared stats — many driven by HTTP Archive data, and in particular the Core Web Vitals Technology report we created to allow you to drill into this data by technology — and they all tell a very positive story:
Well so that’s the question answered then, and this was a pretty short blog post that has now answered the main question posed in its title. Thank you for coming to my Ted post!
A less-optimistic view
Well, not so fast. That first graph is telling you the number of websites that have passed Core Web Vitals. To use that as a proxy for whether the web is getting faster we need to assume a few things:
- The thresholds of passing Core Web Vitals have not changed (they basically haven’t).
- The websites being measured are the same (they will change each month as CrUX has a “popularity threshold” but on the whole they will be roughly the same).
- The Core Web Vitals are the driver of these improvements (and not something else like general network speed improvements, or lots of us being stuck at home with broadband due to some pandemic).
- The measurement of the Core Web Vitals has remained consistent during the time period being measured and has not changed significantly.
It’s that last one that is particular cause for concern. The Core Web Vitals are very young: Annie Sullivan wrote a post on the Web Performance Calendar just two years ago about how one of the three Core Web Vitals (LCP) was developed. So, they have just gone through their terrible twos and, as any parent knows, that means there’s been a bit of a transition.
It’s impossible to get new metrics like this 100% right the first time, and the Chrome team at Google have been working diligently to improve the metrics and address cases where they are not measuring things fairly, especially given the SEO impact. Many improvements have been made to the metrics (all transparently tracked in a public change log).
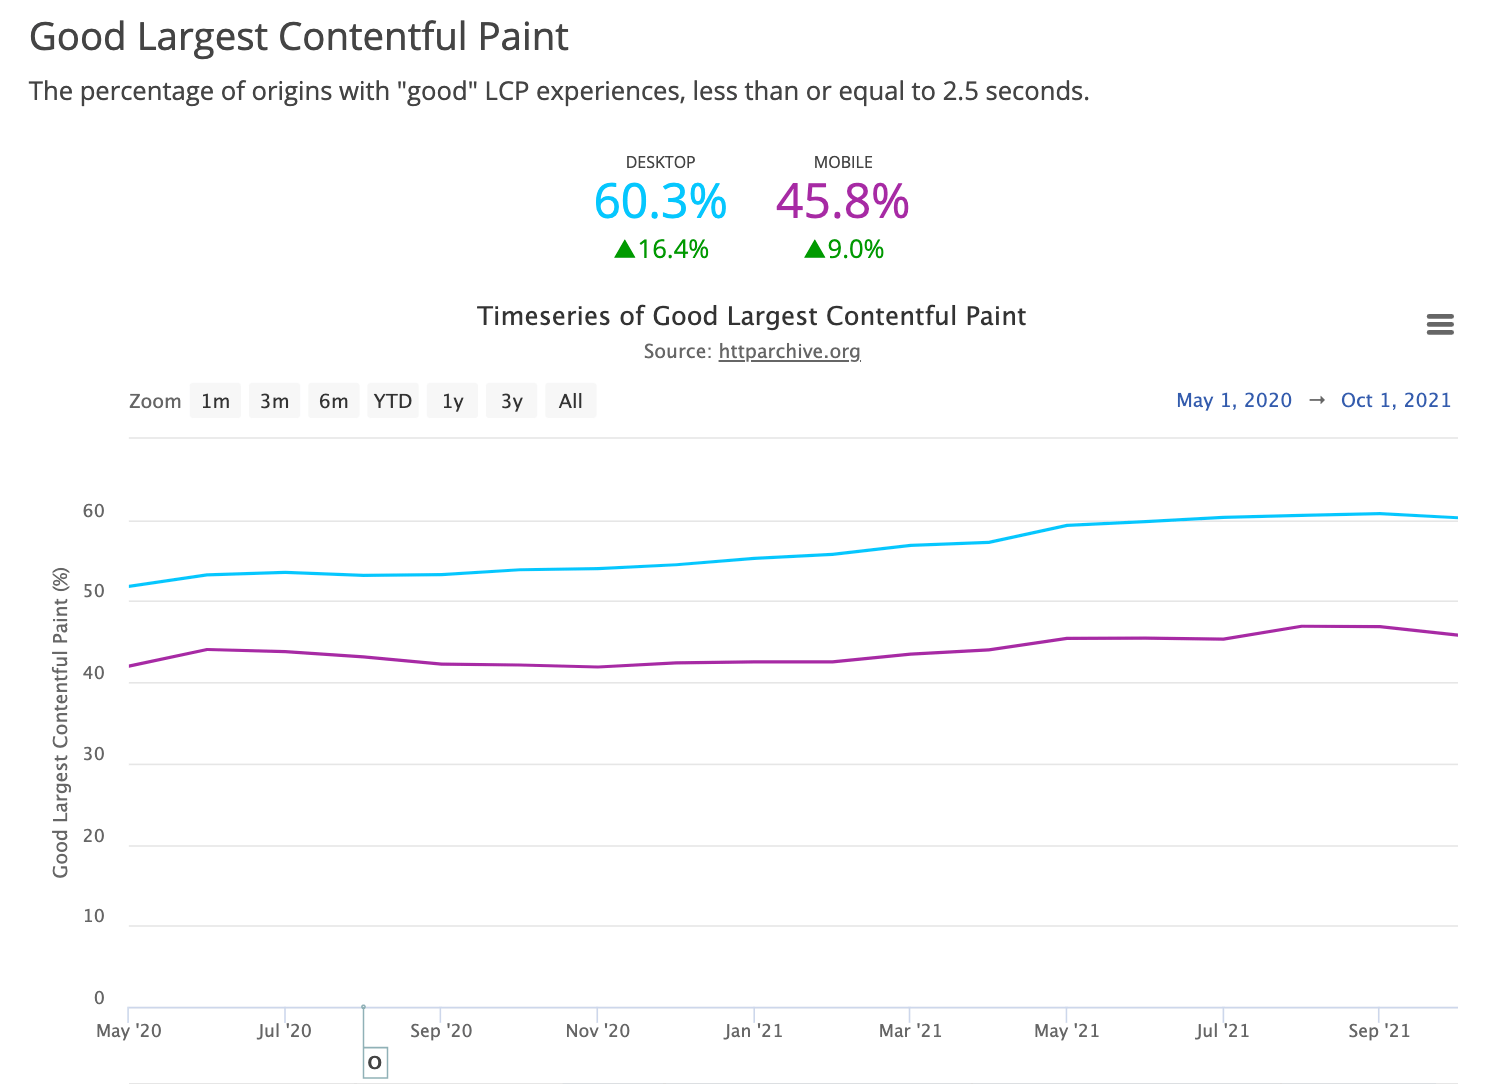
Largest Contentful Paint (LCP) has had a number of changes to help it correctly identify the most contentful element, ignoring invisible images and background images as not “contentful”, as well as changing when the LCP stops calculating. All of these will have an impact (positive and negative), and the graph for LCP improvements is a bit more flat than the first graph I shared — particularly on mobile:
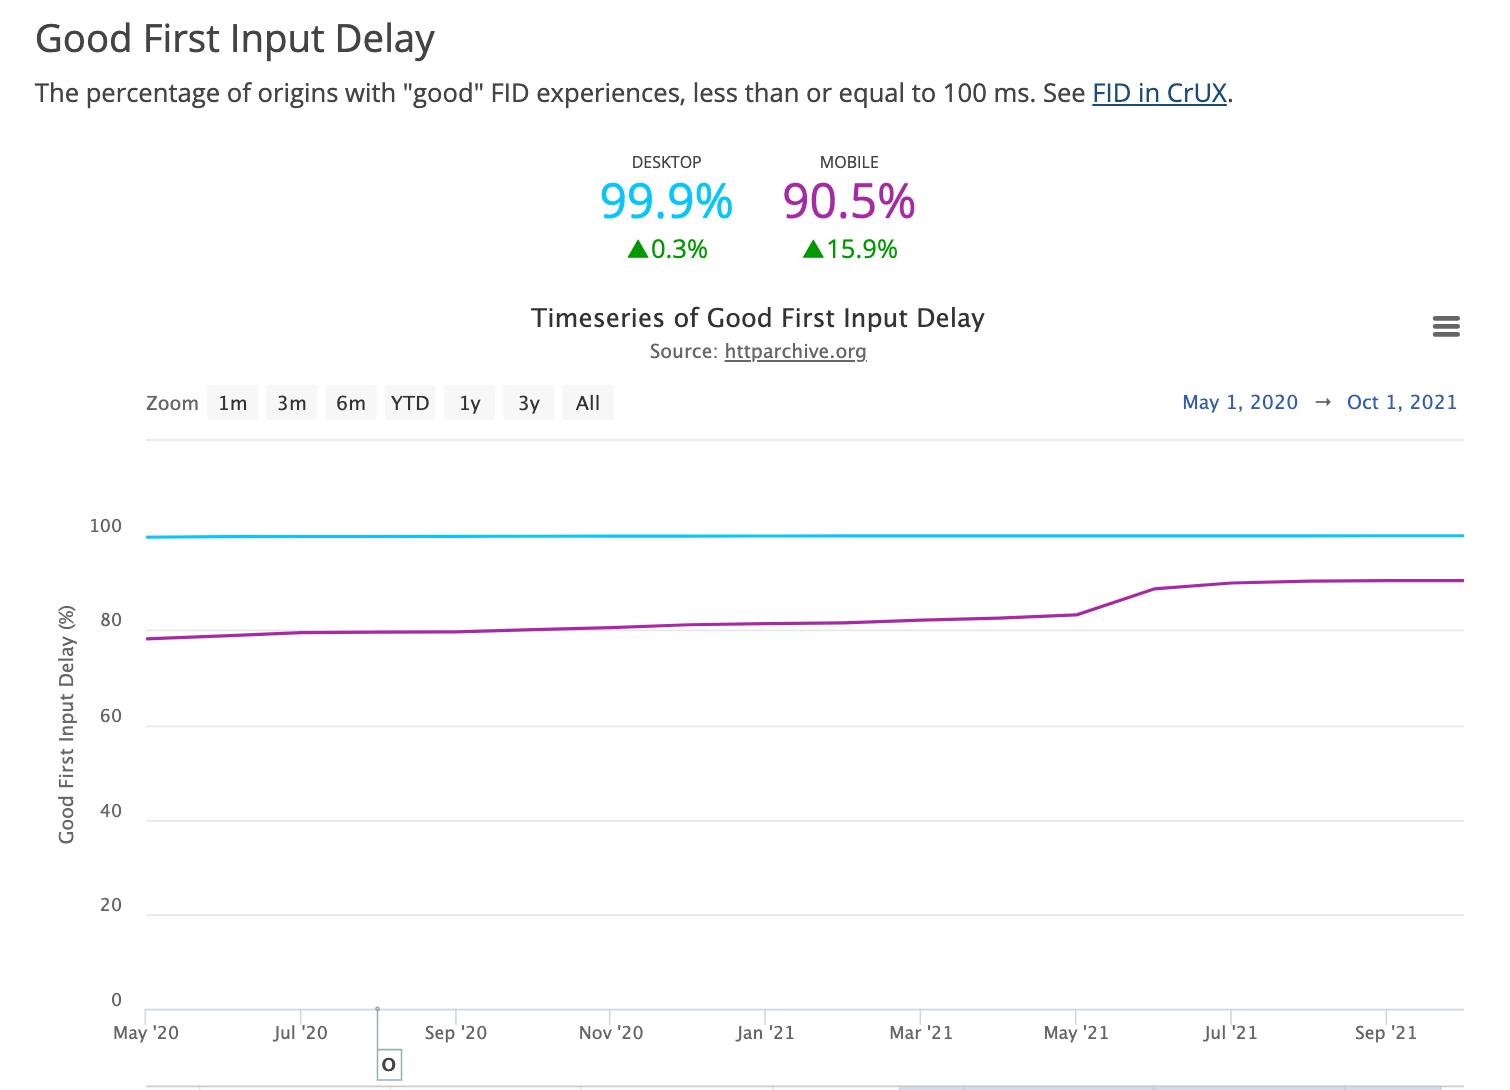
First Input Delay (FID) has had fewer changes, though a change in Chrome to stop double-tap-to-zoom has had a positive effect. It was released in May 2021 and you see an immediate effect on the FID mobile stats after that was released:
FID has always been the easiest of the Core Web Vitals to pass and many (most of all the Chrome team themselves!) are asking if this needs more drastic change. So expect some big changes in FID (or at least FID as it applies to the CWVs) in the next year or so.
And finally we come to the third Core Web Vital, and the one that has changed the most: Cumulative Layout Shift (CLS). CLS, as the cumulative part of its name suggests, used to grow over the whole lifetime of the page. This led to complaints from Single Page Apps (SPAs) were being unfairly penalised as those are expected to be long-lived pages. Even small CLS impacts add up over time to make it more likely to cross the CLS thresholds for “needs improvement” and then “poor”.
CLS was changed to only report the maximum cumulative CLS during a session window. In effect your CLS score is now your worst chunk of CLS shifts within a set time, rather than the total of all your CLS shifts. This change was released in Chrome 91 around May 2021 and looking at our graph we see a jump in good CLS scores coinciding with that:

Further improvements were released in Chrome 93 for September 2021 and again we see a nice bump then.
As well as the metric changes, we also need to remember what baseline we’re measuring from. It’s all well and good to say the number of Angular sites passing all three Core Web Vitals has increased 111% but when you dig in and see that’s from 3% of Angular sites to 6% of Angular sites that improvement seems far less impressive. Particularly given above improvements that those sites will have benefited from without any improvement to Angular as those stats might imply.
So has the web got faster?
So this grouchy Ebenezer Scrooge has put a dampener on this Christmas, and shown that those shouting about the positive impact are maybe a little premature, as they could be caused just from measurement improvements. But many sites have been busy working on improving their performance so to say it’s all due to that, is potentially going too far the other way and being too pessimistic. So how can we separate out these and check whether the web as a whole has improved given the definitions have changed so much?
Well, one way we can do this is to return to our old, more stable, metrics and see what they tell us. Back before the shiny, new LCP, FID and CLS metrics burst on to the stage taking all the limelight, the web performance community used to depend on many other metrics: First Contentful Paint, onLoad, DOMContentLoaded, Total Blocking Time, Time to Interactive, and one of my favourites: Speed Index.
Now let’s be clear, I think the Core Web Vitals are much better metrics. The three CWV metrics aim to measure meaningful impact to users, rather than some arbitrary technical number meant to proxy that experience: the user doesn’t care when the DOM is loaded – they care when the page is showing them what they came there to see. In particular, the switch from lab-based purely synthetic measurements to RUM-based field measurements is a huge improvement. It is much better to report the actual web performance being experienced by users, and so avoid massive assumptions having to be made that your lab-based tests are a good measure of that.
However, needs must, and we’ve shown there’s simply been too much variability in the new metrics to answer the question we’re looking to answer here. The new metrics are better, but that doesn’t mean the old metrics were bad. Any improvements in web performance should also have had a positive impact on them as well. So let’s dive in and see what they can tell us.
I mentioned Speed Index was one of my favourite “old school” metrics. It basically took screenshots of the page as it loaded and calculated how “complete” the page looked at each change and used that to calculate a score of how a page loaded. A page that is mostly loaded, apart from one small section (e.g. the logo), will fare better in Speed Index than one that has nothing painted until right at the end, even if some of the other metrics (e.g., onLoad, DOMContentLoaded) are the same for both.
Speed Index is therefore not too far off what LCP aims to measure, and even includes some of CLS. If the LCP element is loading faster, and the in-loading-viewport content is not shifting around as much, then we’d expect Speed Index to improve as well. Annie stated in the previous post I mentioned that the main reason that Speed Index was not used as a Core Web Vitals, and that LCP was invented instead, is that Speed Index is quite costly to execute so cannot be used in real time. It’s a lab-based only metric.
The HTTP Archive has been calculating Speed Index as part of its run since 2016. The fact that it’s lab-based, means it’s not subject to some of the variability and noise that RUM-based metrics are influenced by. For example, has the speed of networks improved? Are people working from home WiFi more often than mobile networks due to the pandemic? The HTTP Archive run removes those factors since we crawl based on (pretty) consistent hardware, and network runs.
It should be noted that the HTTP Archive uses WebPageTest which has its own definition of Speed Index, which is slightly different from the Lighthouse one (it was based on the WPT one). WPT uses colour histograms so is not impacted as much by content moving around (unless it moves in and out of viewport), whereas the Lighthouse version uses a more complex Structural Similarity Index (SSIM) which is more affected by those movements.
A Speed Index graph was not available on the HTTP Archive website, but since we collected this already, I added the graph as part of preparing this article. Here’s what it shows (lower is better):
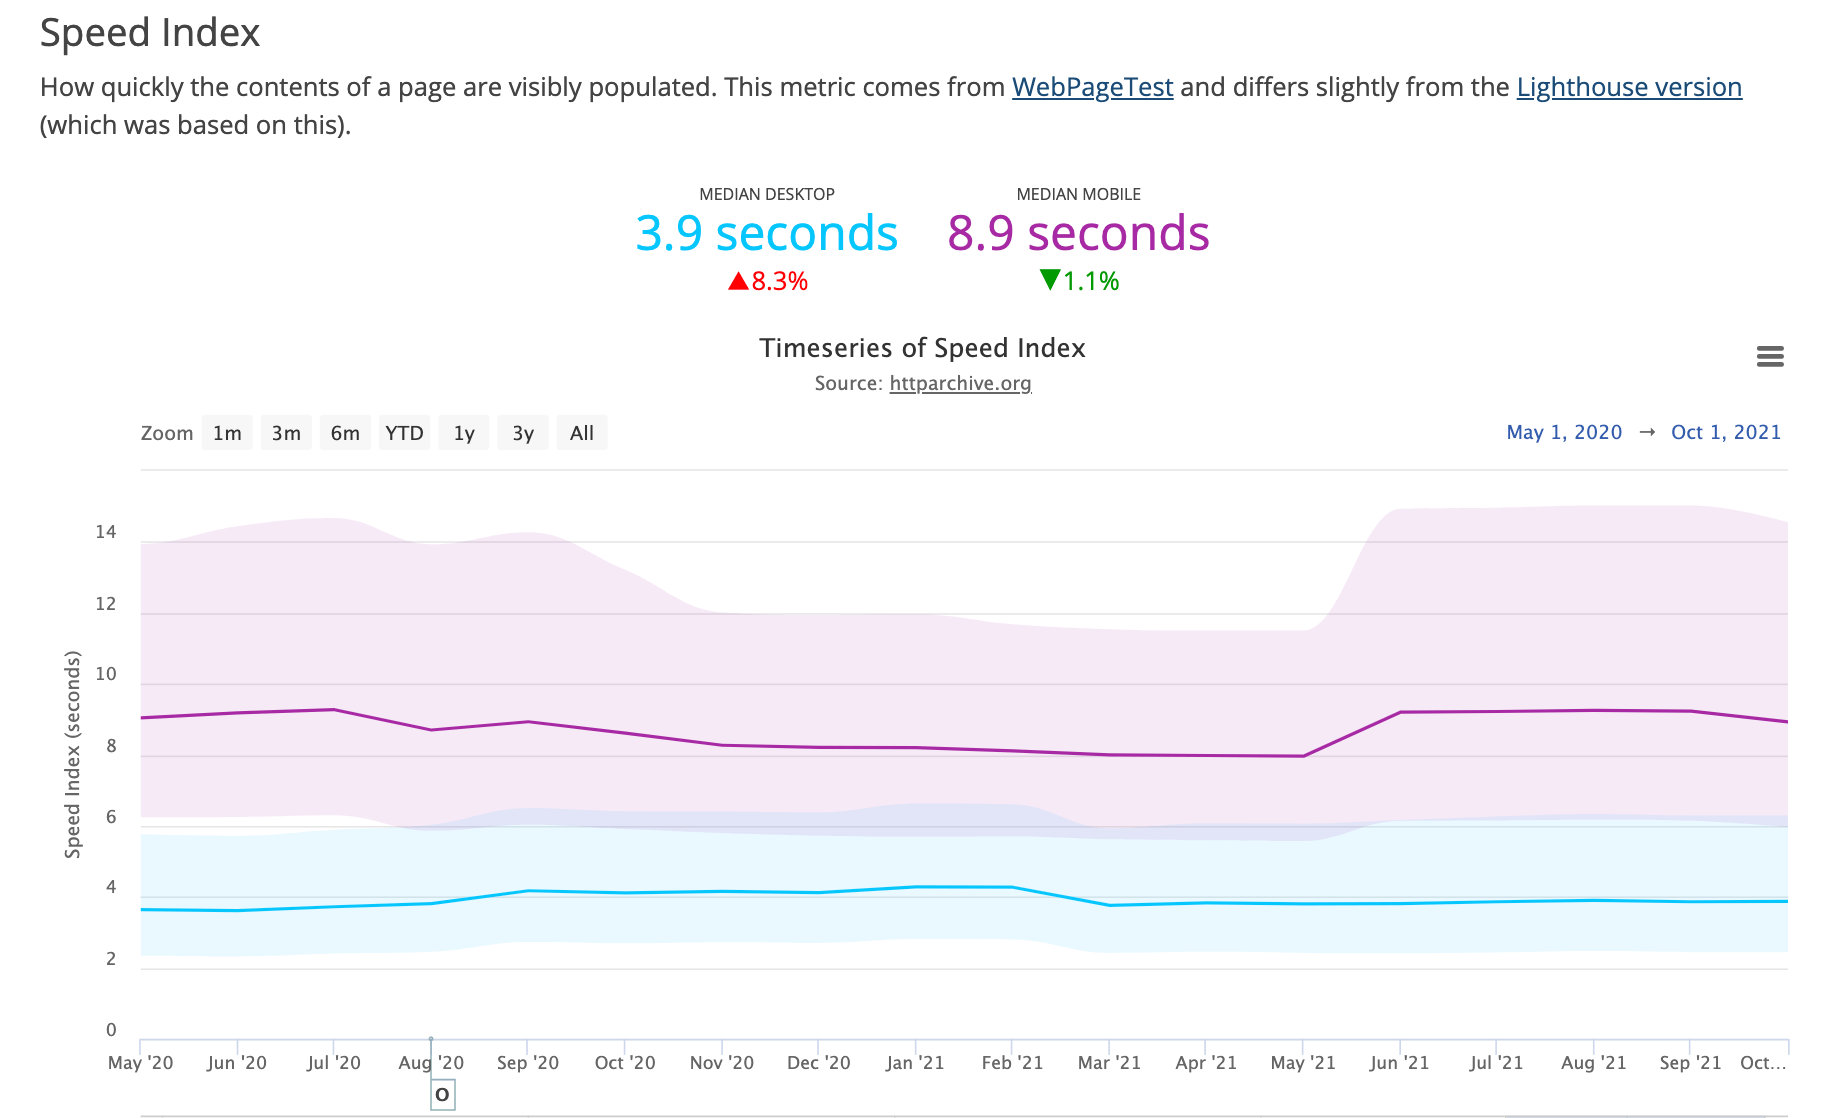
The graph shows what I feared. The web as a whole — as measured by that alternative and less variable metric — does not seem to have gotten noticeable faster since the introduction of Core Web Vitals. In fact we’ve even seen a regression in Speed Index from June 2021 on mobile.
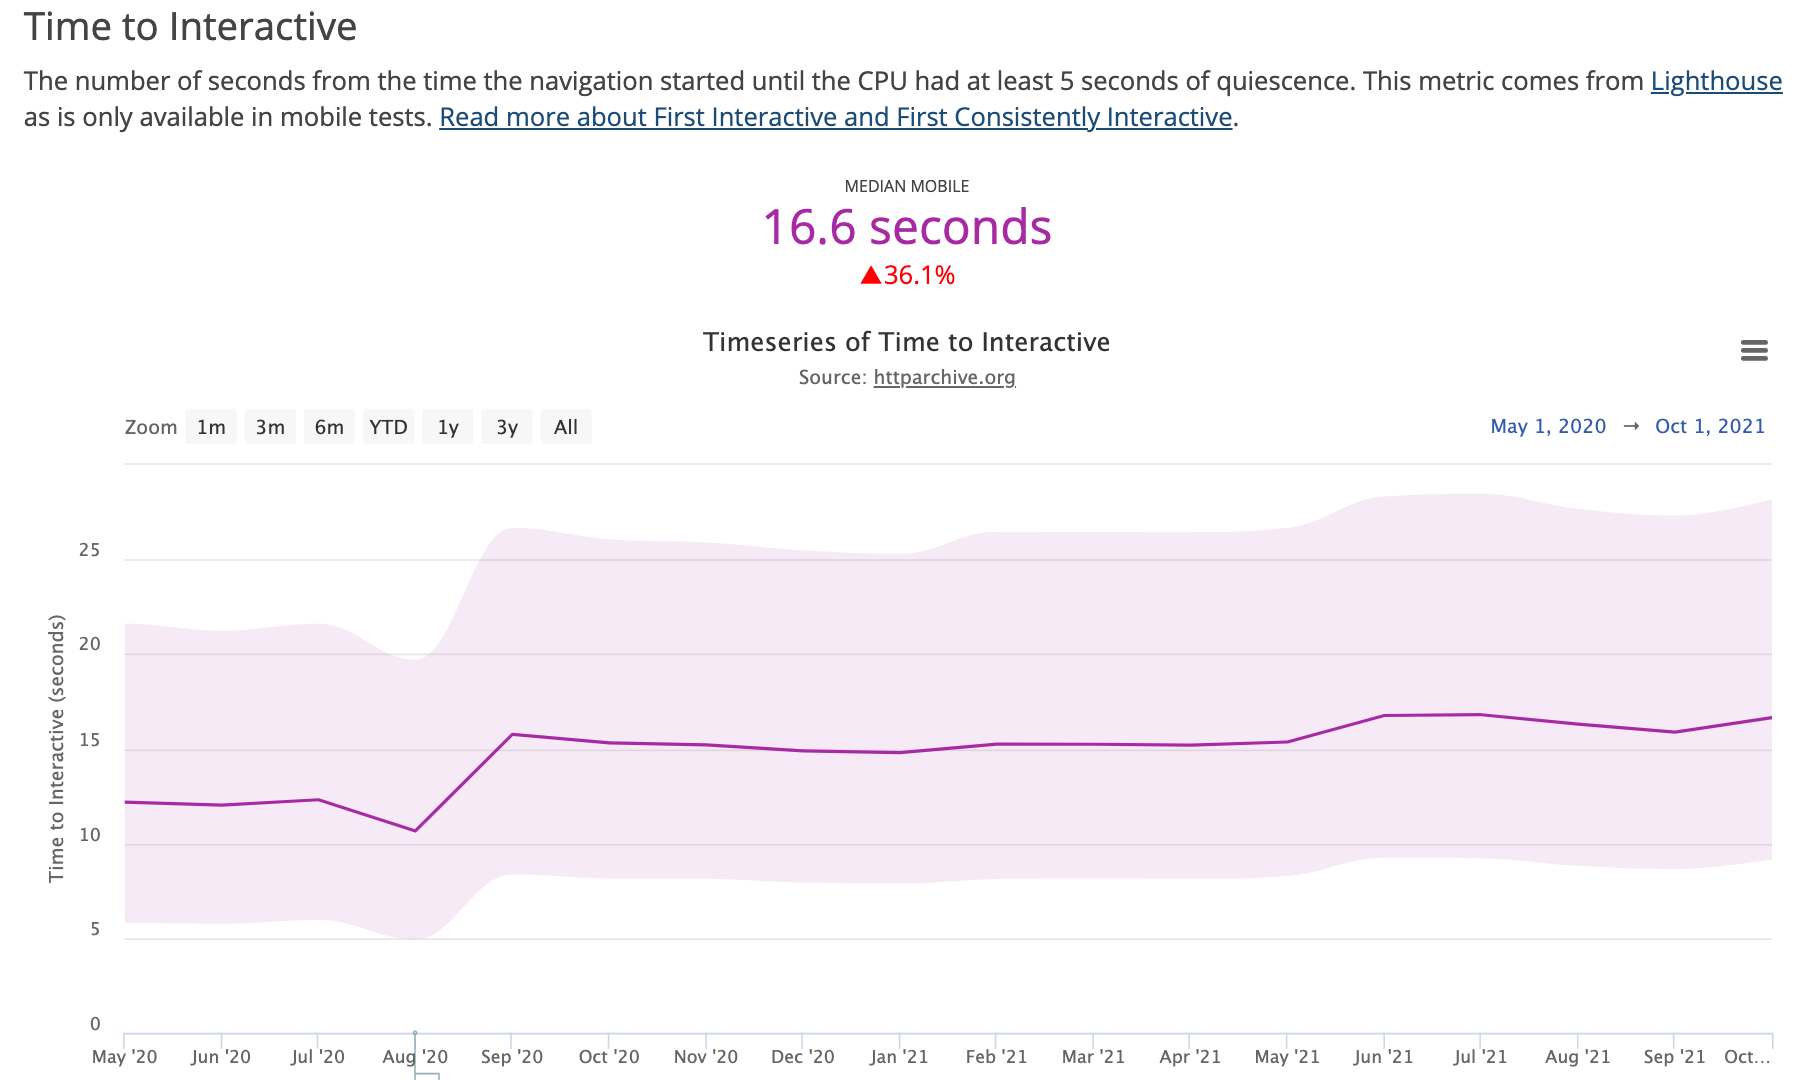
The other metrics in the HTTP Archive Loading Speed report show similar results. No real movement, though First Contentful Paint does show some improvement (though it also has had recent changes). Time to Interactive also shows websites are taking longer to be responsive (too much JavaScript presumably?), a trend that continues on from before the dawn of Core Web Vitals:
Well that’s all quite disheartening isn’t it?
So, it seems from the above, that even Google, and all the massive influence it has over the most popular web browser, and the most popular Search Engine doesn’t have the power to improve performance. That’s quite depressing and sorry to have ruined any webperf aficionados’ Christmas… but I don’t think it’s quite that bad, so let’s end this post on a more positive note.
An important difference is that the HTTP Archive only crawls home pages. The CrUX data is based on real use of websites for all pages. And one of the great things of this initiative is surfacing the performance measurements beyond the home page — which may be the only pages that some people might have plugged into a web performance measurement tool in the past.
It’s entirely possible that home pages were more looked after on the performance front in the past, or are simpler and so less likely to be problematic pages. Perhaps I’m being overly negative here and the CrUX data above is more representative of real improvements we’ve seen? I think the truth lies somewhere in between, but hand-on-heart probably closer to what the HTTP Archive crawl graphs are telling us. The CrUX based graphs will be much more interesting for the future though, assuming the metrics settle down a bit as they mature.
Changing things at web scale is hard. No matter how much influence you have. The HTTP Archive crawls over 7.5 million websites as part of its crawl and, despite all the hoopla that the web performance and SEO community have seen on performance, the vast majority of those sites will not have been significantly changed during that time. But many have, and maybe websites surely have gotten faster – but just not enough yet at a scale that can make a meaningful impact when measuring the web as a whole.
I like the Core Web Vitals, I think they are great metrics, and I appreciate the investment Google has made in them, and the pressure they are putting on websites to improve, even if we have grumbles about certain pieces of the initiative (grrr to the lack of transparency about page groupings in Google Search Console!). The fact that the metrics are still evolving is massively positive, not a criticism, and shows the recognition that they were the next step on the web performance journey, rather than a fait accompli that is done now and allows us to move on.
Even if we can’t yet see the impact on the HTTP Archive numbers above, the fact is we are having many more conversations about web performance. And the fact that those conversations are now also taking place outside of the relatively small (but always welcoming!) web performance community is a great thing.
Ending on some good news stories
When we look at the top 1,000 websites the amount of websites passing Core Web Vitals has improved more than overall: for all websites there’s been a 32.8% improvement for mobile websites from May 2021, but for the top 1,000 that 37.1%.
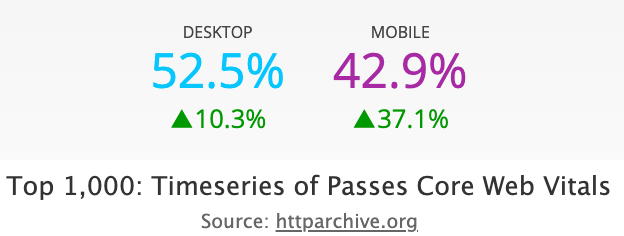
Obviously bigger sites have bigger budgets (and more incentive to improve things), and maybe more of a finger on the pulse of SEO trends. Then again, it could also be due to the fact that those sites may have had a bigger impact from the metric improvements, but I’m still taking it as a positive sign. Often these sites lead and then there is a trickle-down effect as the rest of the web catches up.
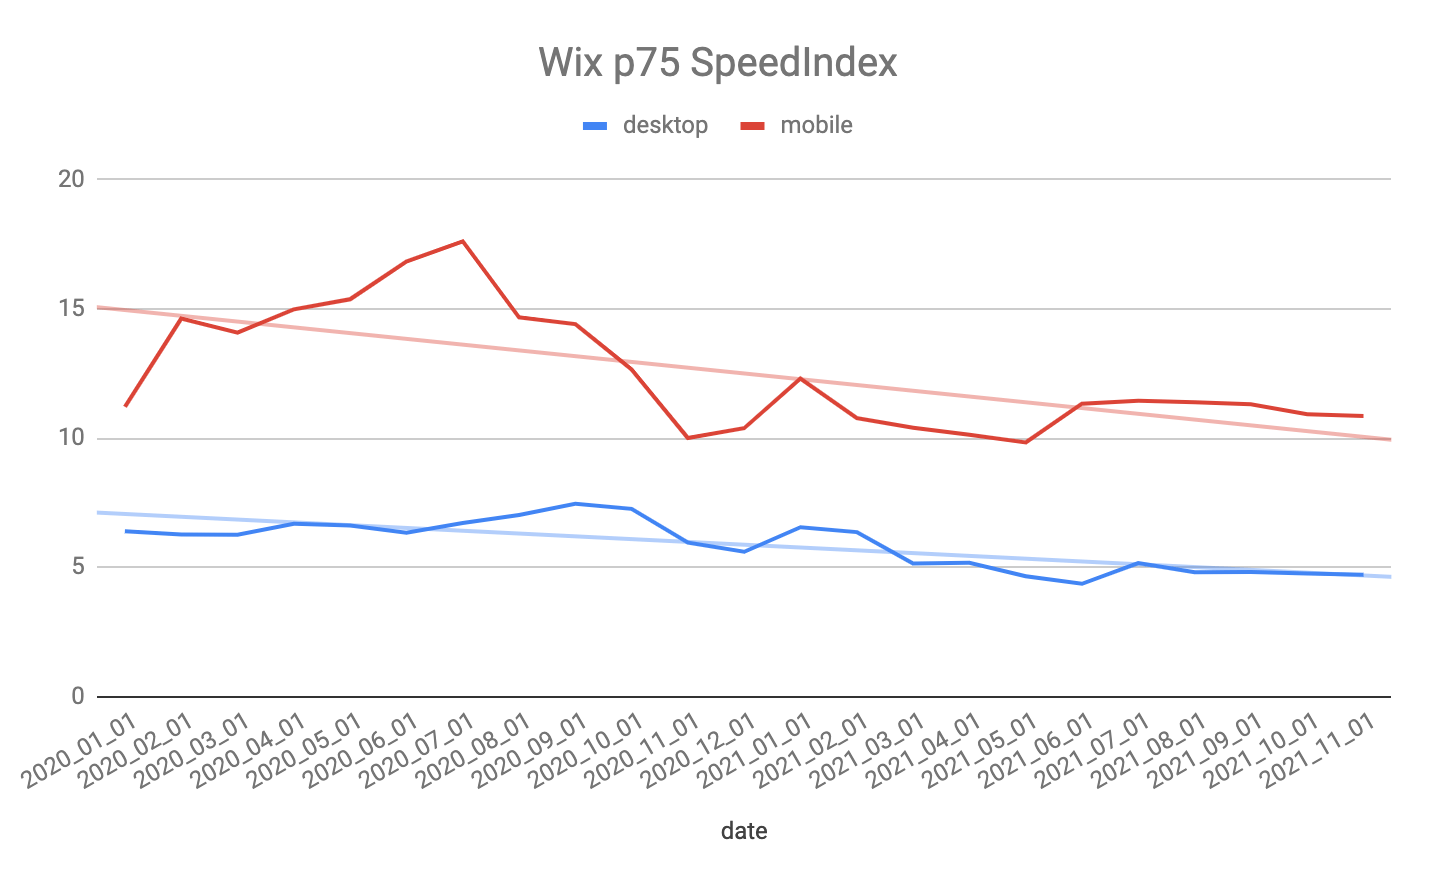
We’ve also seen some platforms like Wix investing a huge amount of effort in improving their performance and those websites are seeing that effort reflected in their HTTP Archive Speed Index scores (which helps justify my decision to use that metric, and alleviates some of my concerns about how representative this is compared to CrUX!):
Here is where the relative improvement from other platforms (as can be seen with the Core Web Vitals Technology Report) are perhaps a better metric than just looking at one platform at a time? Plus a little competition here is surely a good thing!
Perhaps more excitingly, WordPress, which powers a third of the web as a whole, recently raised a Proposal for a Performance team in response to the improvements that Wix and others have highlighted, and to avoid the perception WordPress being seen as falling behind. WordPress does have the power to “move the web” — as demonstrated by their adoption of native lazy loading (though with great power comes great responsibility and there is some evidence that implementation was a bit too naive).
Just answer the question already!
So have Core Web Vitals made the web faster? I think yes, but the numbers aren’t quite that clear cut as some of them might suggest. However, if more platforms follow the example of some of those mentioned here, and invest more in web performance, then the numbers above will undoubtedly follow. Perhaps next year, I’ll have that much shorter blog post to just say all is on the up! Until then, make sure you understand what the metrics are telling you, and question anything that seems too good to be true — even if it is the story you wish was the case.
Many thanks to Patrick Meenan for answering questions for this article – not to mention for creating Speed Index, WebPageTest and so many other great things for measuring and improving web performance!