Tsvetan Stoychev (@ceckoslab) is a Web Performance enthusiast, creator of the open source Real User Monitoring tool Basic RUM, street artist and a Senior Software Engineer at Akamai.
Did you know that at the moment, right now, RUM and performance data is being collected from the Web Performance Calendar?
Yes, that’s true!
There is a 99.9999% chance that while you are reading this, your browser is firing a beacon that’s travelling to the Hentzner’s datacenter in Nuremberg.
Thanks to Stoyan Stefanov, at the beginning of December 2022 the Boomerang JS library was installed on https://calendar.perfplanet.com/ and configured to send beacons to a Basic RUM beacon catcher.
Great! We are collecting RUM data but what about making sense of the data?
Show me the graphs!
For the very curious I created a Grafana user with Viewer permissions.
Visit: https://friends-dashboard.basicrum.com/login
Use the following credentials:
- Username: calendar
- Password: calendar

We have 3 interesting dashboards:
- Core Web Vitals – https://friends-dashboard.basicrum.com/d/JTqktGc4z/core-web-vitals?orgId=1
- Metrics Explorer – https://friends-dashboard.basicrum.com/d/6lbe2GcVz/metrics-explorer?orgId=1
- Summary – https://friends-dashboard.basicrum.com/d/m9sXtGcVz/summary?orgId=1
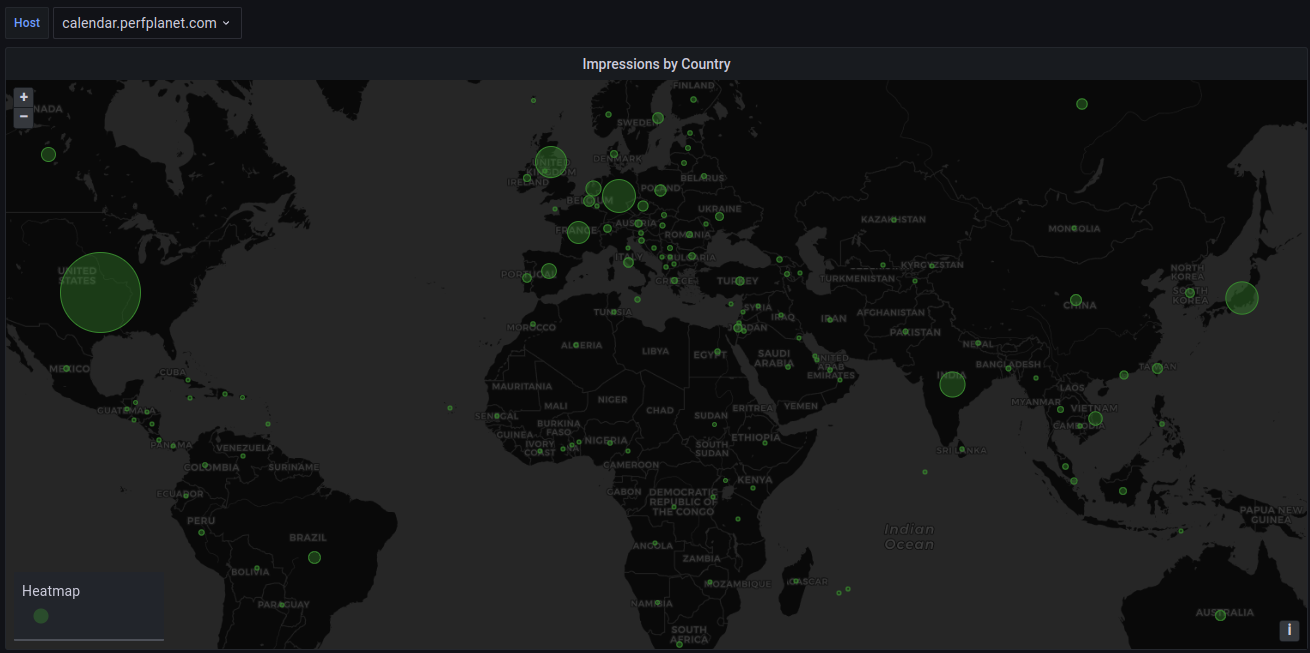
For me the most interesting panel is the Impressions by Country panel. This panel is part of the Summary dashboard. With the help of the builtin Geomap Grafana plugin, a bit of SQL and configuration we got the result shown in the screenshot below.

It’s obvious that the Web Performance Calendar is trending in the USA, Germany, Japan, Great Britain and India but what really amazes me is the visits from so many countries. At the moment of writing this article we got visits from 145 countries.
Another interesting panel that caught my attention was the Time To First Byte. I could feel the latency when I load the Web Performance Calendar from Bulgaria or Germany. I suppose that the Performance Calendar is living somewhere in a datacenter in the USA and that’s why there is a bit of latency for me and other folks who live outside North America.

With the help of the Plotly Grafana plugin I could visualise histograms for a given time window.
Below we got histograms for Time To First Byte for the last 30 days.
Time To First Byte – Desktop

Time To First Byte – Mobile

A deep dive into the Plotly plugin
The Plotly Grafana plugin gives us flexibility and better control when we draw diagrams. Very often the builtin Grafana plugins work just fine for time series data but I couldn’t find a good way to decorate the Core Web Vitals thresholds the same style we have for the Time To First Byte histograms shared earlier in this article.
Let’s take a quick look at the edit window of the Time To First Byte panel that was built on top of the Plotly Grafana plugin.

By injecting a bit of JSON and JavaScript in the 2 highlighted text areas we control how to display the data in the Grafana panel.
- A JSON that controls the Plotly layout: https://gist.github.com/ceckoslab/abd28c685254159a33e635910b8e617d
- A JavaScript that maps the returned data from ClickHouse to buckets. This glue code also takes care about setting the correct colours for each threshold: https://gist.github.com/ceckoslab/5fcc4a1638cc95562a10da2ad5f4d14f
How does Basic RUM work?
For the really curious, let’s take a look at a high level overview of the Basic RUM components:

- A visitor loads a webpage and with the help of Boomerang JS we collect performance information and other page details. The performance data is sent over a beacon to the Beacon Catcher server.
- The Beacon Catcher server persists beacons in a raw format in a temporary storage prepared for reading and decoding on the next.
- The beacon decoding service reads a batch of raw beacons, decodes them and prepares the decoded beacon data for inserting into a ClickHouse DB.
- The raw beacons are bundled, compressed and stored in a file system. The stored beacons could be used as a backup or re-imported in case we add new columns in ClickHouse DB.
- The decoded beacon data is inserted in a flat table in ClickHouse DB. Columns in this table for example are: Time To First Byte (TTFB), First Input Delay (FID), Largest Contentful Paint (LCP), Cumulative Layout Shift (CLS) and others.
- Grafana visualises performance information by querying ClickHouse DB. We have a bunch of pre-backed dashboards that visualise Core Web Vitals and other performance data in histograms, percentile, barcharts and more.
What inspired me/motivated me to continue working on Basic RUM in the past year?
Real feedback
It’s really hard to have a goal without getting feedback from outside my bubble. Luckily a friend of mine connected me with a company that runs hundreds of WooCommerce shops. The dev team behind this company was really curious to look at some stats and to understand when their customers are experiencing problems. Basically they wanted to know that there is a problem before the worst case scenario – they get a phone call from a client complaining a webshop feels really slow or seems to be broken.
We installed Basic RUM on some of the most important customers’ webshops and together started building Grafana dashboards. This was free of charge because I am still not sure about the commercial part of Basic RUM but it was amazing to hear questions from this team that started with “How … ?”, “Why … ?” and “What is … ?”. Most of the dashboards we see today for Web Performance Calendar were built based on the feedback I got from this team.
The ClickHouse community
Also I can’t miss mentioning the support of the ClickHouse DB community. This community is amazing and has about 99.9999% of a response rate over Slack questions. I even had a chance to shake hands with part of the core team during their Meetup tour as part of a Meetup that took place in Munich. I even gave a short talk about My journey as a ClickHouse beginner.
I want Basic RUM on my website!
Basic RUM is built on top of 4 components:
- Boomerang JS – a browser library that collects and sends RUM data.
- Beacon catcher – Golang application server that will be soon shared publicly (currently living in a private GitHub repository). I am still working on completing some features and fixing stability issues.
- ClickHouse DB – an open source database for analytics queries. I had an intro about this DB last year – ClickHouse: Don’t miss out on this database
- Grafana – an open source system for data viz.
During the past year I built confidence with all the 4 components but I am still figuring out how to package the components all together.
In the next few months I will focus on scripting the provisioning and documenting installation process of Basic RUM. It will be open source and of course the floor will be open for contributions.
Meanwhile if you are curious to try Basic RUM reachout on:
- Email: Tsvetan Stoychev – tsto@basicrum.com
- Twitter: @ceckoslab
- Mastodon: https://webperf.social/@tsvetan_basicrum
I can assist with some of the manual installation steps or we can send some beacons to the already provisioned system used by friends/for demonstration purposes.
Thanks
Thanks to Barry Pollard and Andy Davies for helping me with proofreading the article and helping to make it better!
