

Sander van Surksum (@SSurksum) is a Web Performance Consultant, with 20+ years in tech, founded Iron/Out, dedicated to speeding up websites. He's passionate about improving online user experiences.
At the recent PerfNow conference, Tammy Everts highlighted a major challenge in web performance: the excess of different metrics. This issue becomes clear when considering a scenario like a retail company launching a new website. The web development team tracks various metrics like load time, user interaction, and server response times. However, for the marketing team and company executives, understanding the implications of each metric is complex and time-consuming.

Photo credit: https://twitter.com/JeenaJ/status/1585605697949122560
This is where the beauty of a single, aggregate score comes into play. Imagine the retail company using the Lighthouse Performance Score as surfaced in tools like PageSpeed Insights. This single number summarises the overall web performance, making it easier for non-technical team members to understand and make decisions. For instance, if the score is low, the marketing team immediately knows that enhancements are needed to improve page experience and potentially increase sales.
In this fast-paced business environment, a unified score stands out. It distils numerous technical metrics into one straightforward figure, initiating discussions and decisions efficiently. A single score serves as a clear benchmark for performance, allowing teams to focus on improving that number, knowing it represents a range of underlying technical factors.
The role of Lighthouse Performance Score
The Lighthouse Performance Score has its place. It’s the spark that ignites discussions on web performance, a familiar reference point for many. In the fast-paced world of business, where time is a premium and simplicity is valued, this score provides a quick snapshot, a starting line from which deeper analysis can ensue. For stakeholders, it’s often a first glance at the health of a website–a pulse check, if you will.
Should we keep the Lighthouse Performance Score?
But should we continue to rely on the Performance score as the barometer of a website’s performance? As we delve into the essence of what this score represents, a compelling narrative emerges. The Performance score has long served as a key benchmark in evaluating website performance, but it falls short in representing the full scope of a user’s experience. This limitation stems from its lab-based nature, focusing solely on a single page load under predetermined conditions. It measures just the initial loading process, not accounting for the entire lifespan of a page or the various interactions a user may have with it. Lighthouse, in its default configuration, doesn’t capture these ongoing user engagements and interactions, missing out on the nuanced, real-world experiences that occur as users navigate and interact with a page over time. A high Performance score can still coexist with a user experience that’s less than satisfactory — a paradox that highlights the score’s limitations. It’s evident that while Lighthouse is a valuable tool for gauging certain aspects of website performance, it falls short in providing a holistic view of the overall user experience.
Recent rumours also suggest that the Performance score might be removed from the PageSpeed Insights tool. While this move could be seen as an acknowledgment of the score’s limitations, it’s important to recognize the role that this score has played in the industry. Despite its flaws, the Performance score has been instrumental as a conversation starter among web developers, marketers, and business stakeholders. It has brought attention to the importance of website performance and has been a catalyst for discussions around optimisation and user experience.
Talking with the business
Our company, Iron/Out, helps businesses make their websites work better. We measure websites to find problems, fix them, and make sure they don’t happen again. When we talk to the people who run these businesses, we have to explain how the website is doing in a way they can understand.
We see that they need a simple way to know if a website is good or not. So, we made something we called the UX score. This score looks at what really matters to people who visit the website. It’s easy to understand and tells us if the website is fast and works well for everyone. The UX score helps everyone, from IT people to business leaders, make smart choices to improve their websites for the people who use them.
UX score
The UX score transcends the Performance score by integrating more facets of a user’s encounter with a website. It doesn’t just measure how fast a page loads; it measures how well the page performs in the wild.
The base calculation
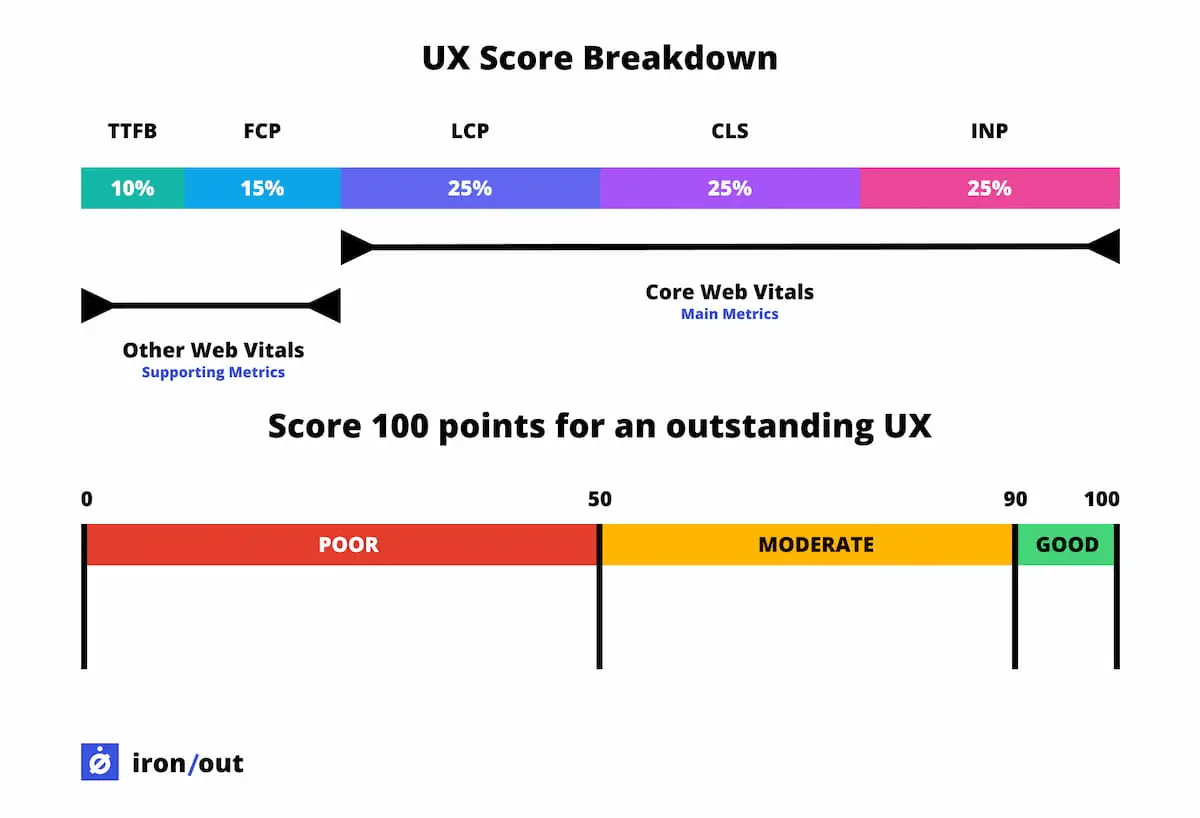
Every Web Vital metric is rated from 0 to 100, depending on how well it performs. There are also specific criteria to judge each metric. For example, Core Web Vitals set certain target levels for each metric to classify the user experience as “good”, “needs improvement”, or “poor”.
As for how this is evaluated, Google already has a method in place. They gather information on user experiences from Google Chrome and Web Vitals. This data, collected anonymously and in aggregate, can be accessed through Google BigQuery, the CrUX API, and several online tools.
Factoring in the Weights: Core Web Vitals take centre stage
In our scoring system, we assign points to each Core Web Vital based on their performance against set thresholds. The core trio — Largest Contentful Paint (LCP), Cumulative Layout Shift (CLS), and Interaction to Next Paint (INP) — are pivotal, each contributing 25 points to the overall score. We’ve moved our focus from First Input Delay (FID) to INP, as it offers a more accurate measure of page responsiveness. In scenarios where INP data isn’t available, we automatically set full marks to ensure fairness in evaluation. Additionally, supporting metrics such as Time to First Byte (TTFB) and First Contentful Paint (FCP) contribute 10 and 15 points respectively. This distribution of points is based on the already defined performance thresholds set by Google. A metric categorised as ‘good’ earns the full 25 points, while one deemed ‘poor’ receives 0 points. This approach ensures a comprehensive and nuanced reflection of a site’s performance, considering a range of factors that impact user experience.
Aiming for perfection: What a 100-Point UX Score represents
Achieving a UX score of 100 is akin to reaching the zenith of web performance. It signifies a site or a page that is not just fast but also stable and responsive. A high score confirms the server’s swift reactions (TTFB) and the prompt display of initial content (FCP).
When good isn’t good enough: The role of Core Web Vitals in UX
In our scoring system, a score of 90 or higher means the website provides a “good” User Experience. However, the role of Core Web Vitals is crucial here. These vitals are like the main supports of a smooth website experience, focusing on the elements that users notice first and foremost. But here’s an important rule: if any one of these Core Web Vitals is not up to par, the website’s total score won’t go over 90, even if the other metrics are performing well. This rule is there for a reason. We want to encourage websites to not just excel in some areas but to be outstanding across all aspects of the user experience. It’s about ensuring consistency in quality, making sure every part of the website contributes to a great overall experience.
How customers are leveraging this UX Score
Our customers have been actively using the UX Score to transform the way they discuss and manage website performance. This single, comprehensive metric has become a crucial tool for them, simplifying complex technical data into an easily understandable format. By focusing on this score, teams are able to communicate more effectively about performance issues, identifying areas that need improvement with greater clarity. This approach has not only improved their ability to make decisions but has also fostered a more collaborative environment.
Moreover, this score has a unique role in fostering accountability across departments. Marketing, sales, CRO and tracking teams can now directly observe how their tools and strategies influence the overall score. This visibility encourages a sense of responsibility and motivates these teams to optimise their methods, ensuring they contribute positively to the website’s performance.
Conclusion
We acknowledge the evolving nature of the digital landscape and the significance of measurement tools like the PageSpeed Insights score. While we don’t advocate for its removal, we hope to see it evolve into a more comprehensive scoring system based on real user data. This score has undeniably brought critical attention to the importance of website performance, serving as a catalyst for ongoing discussions about optimisation and improving user experience. From our experience with customers, we’ve observed that business professionals generally prefer a single score to assess their website’s performance. If we don’t offer a more holistic scoring system based on RUM, they are likely to keep using the existing Lighthouse Score.
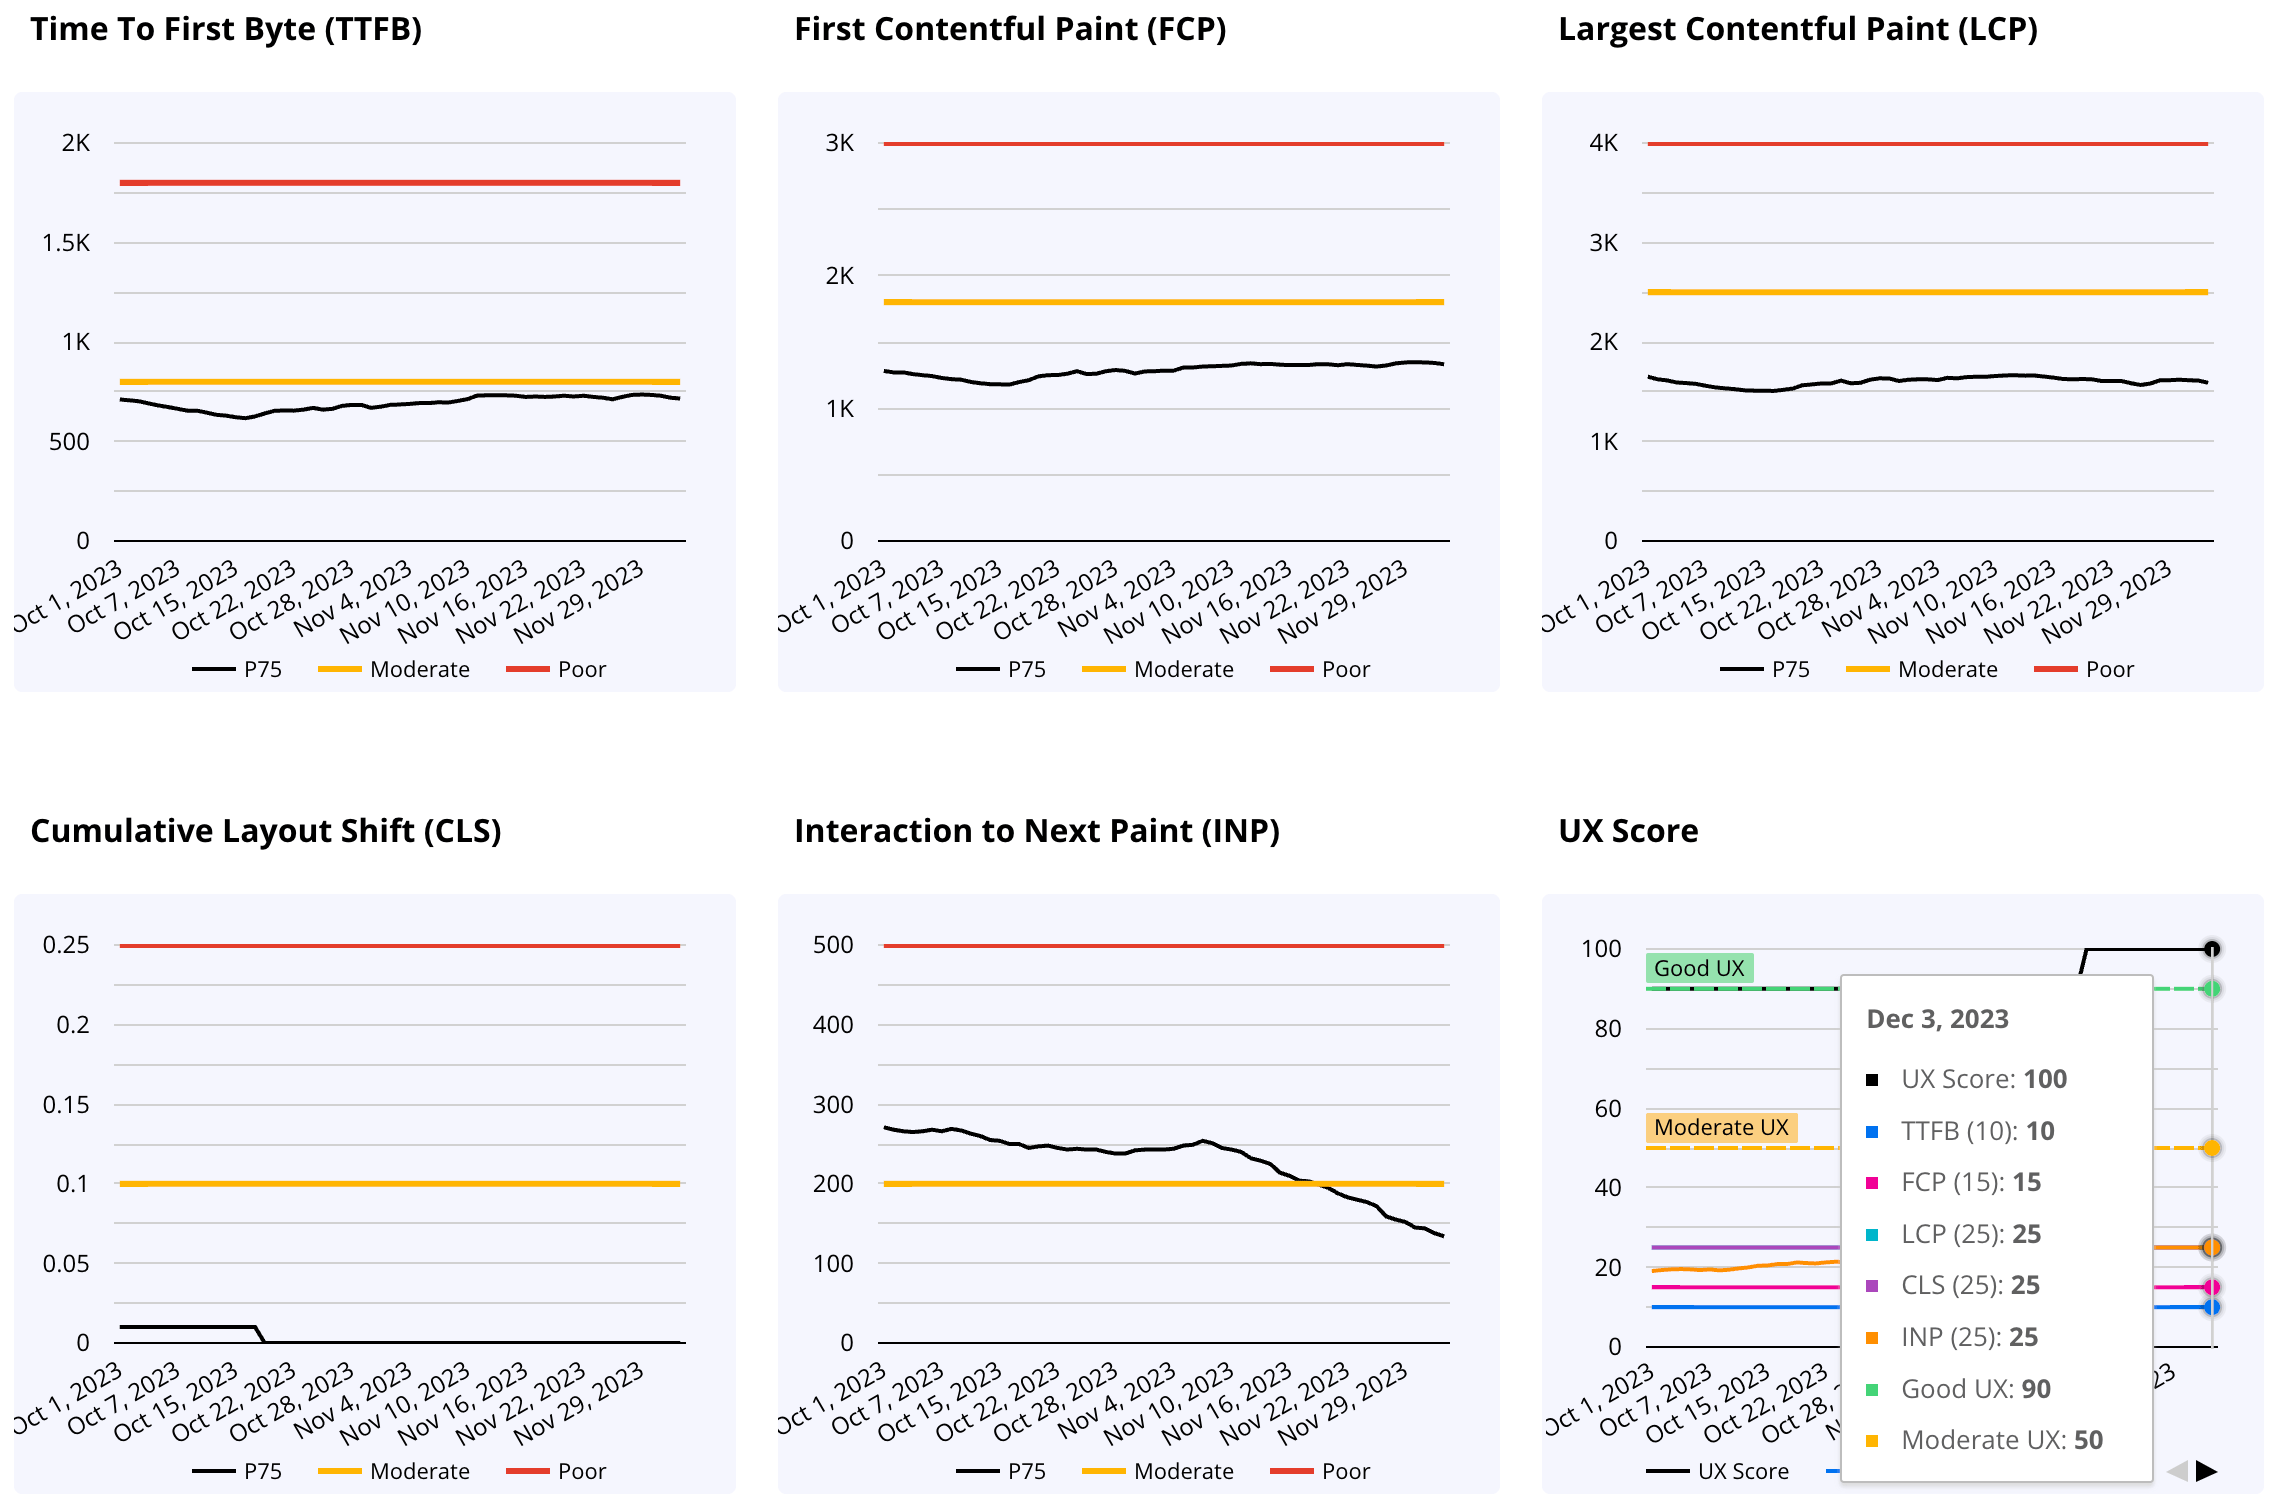
Should you already want to get a feel for what UX Score your pages are delivering, try pagespeed compare which uses field data (CrUX) to calculate the UX Score discussed above.