

If you’re reading this, you probably already know that Interaction to Next Paint (INP) will become the new Core Web Vital metric for responsiveness in March 2024. INP has already been talked about a few times in this year’s Perf Calendar by Brian, Ivailo, and Sander, so if you need a refresher on what it is and how to optimize it, I’d definitely recommend checking out their articles first.
This article will explore something similar to Brian’s post, in which he used RUM data to understand how INP performs on different page types across thousands of websites. For this post I’d like to take it a step further and look at not only how INP performs, but also what some of the common characteristics of slow INP interactions are–using attribution data from real user experiences.
No, I won’t be using HTTP Archive or the Chrome UX Report datasets (much). Instead, I’ve partnered with RUMvision to pore over some of the INP data they’ve collected in the field. So for the rest of this intro, I’ve asked the good folks at RUMvision to talk about their company and the dataset that they provided. All credit for everything between the <RUMvision /> tags goes to Erwin Hofman, Jordy Scholing, and Karlijn L�wik.
<RUMvision>
About RUMvision and its dataset
RUMvision is a real-time page speed and UX monitoring solution (real user monitoring) built on top of Google’s web-vitals library. As a relatively new real user monitoring (RUM) solution, and thus flexible, it began reporting on INP per template, device memory, per element, and an INP breakdown, all from launch in early 2022.
However, the Chrome development team acknowledged that INP insights were lacking, specifically which JS elements, in both first and third-party impact, were the cause of an INP. As a result, when the LoAF API origin trial was announced, RUMvision quickly recognized the added value. The RUMvision team began working on the experimental LoAF API in July 2023, and it was made available to customers who requested it in August 2023. As the first RUM solution to use this new method of tracking the INP, there is now a large dataset to dive into based on real user experiences. And it’s a game-changer!
What exact RUM data was used for this analysis?
Rick Viscomi (Google) and Erwin Hofman (RUMvision) discussed publishing the results of real user monitoring data at the performance.now() conference. As a result, RUMvision granted Google access to its records–specifically, aggregated performance data from LoAF-enabled user experiences–to assist in the writing of this article. No data on any individual, unaggregated user experiences was shared.
This article will look at data from October 1st, 2023 to December 1st, 2023. The dataset is comprised of 6,363,644 pageviews, with 3,540,750 on mobile, 2,687,336 on desktop, and 135,558 on tablet.
What is LoAF?
Long Animation Frames (LoAF) are a performance timeline entry for diagnosing sluggishness and poor INP. You can observe or query when work and rendering block the main thread, and which scripts were the potential culprits. LoAF, a revamp of Long Tasks, aims to help with this. A LoAF is an indication that the browser was congested at a specific point in time, such that it took a long time from the start of a task until updating the rendering (or until it was clear that no render was necessary).
Because busy, “LoAF-heavy” sequences can potentially cause delayed response to interactions, and the LoAF entries themselves contain information about what was blocking, e.g. long scripts or layout, LoAF has the potential to become a powerful tool, allowing RUM solutions like RUMvision to diagnose these types of performance issues.

“Have you had a look at LoAF yet? A great way to track down the long-running JavaScript issues on your site in the field.” – Barry Pollard on LinkedIn
How RUMvision collects LoAF data
As a website or webshop, it can feel difficult to configure an origin trial. However, if you’re using RUMvision it’s really simple, as the JavaScript snippet of RUMvision can be configured to enable the trial for all Chromium visitors, simply by turning it on within the settings.
As a performance monitoring solution, RUMvision is careful not to contribute to unnecessary poor page performance, which would be ironic. Therefore, it doesn’t track all LoAF entries. Instead, it focuses on those LoAFs that occur during user interaction, or to be more precise, a user interaction that resulted in a long LoAF and caused web vitals to report INP.
Here’s how it works:
- Within a LoAF, there could have been multiple tasks batched together, even those caused by different JavaScript sources.
- Within a LoAF that happened during an INP interaction, RUMvision only grabs the single script with the longest duration.
- The information is then categorized into delay, compile, and execution time for each script.
- RUMvision uses the execution time, which is often the highest of the three, to represent the pure JavaScript execution time in its Third Parties dashboard.
All other distilled information gathered is still available in RUMvision’s technical dashboards.

Overview of a third party impact dashboard within RUMvision
In terms of reporting, RUMvision also tracks other LoAF information. However, when it comes to identifying the exact third-party vendor and JavaScript file, there’s a balance. This balance is between not collecting more data than necessary and still providing actionable information.
A JavaScript file needs to have a certain number of occurrences before it’s included in the INP impact scores that RUMvision shows. This threshold ensures that when a file is identified as impacting INP, the correlation is strong and reliable. This information is crucial in determining whether INP issues are mainly caused by third-party or first-party JavaScript and identifying specific third-party scripts to focus on.
This data collection strategy by RUMvision aids site owners and other stakeholders in understanding performance issues without getting overwhelmed by the technicalities in Chrome’s DevTools. However, there comes a point where developers need to step in and act on this data, which could involve further investigations or making changes to the website’s JavaScript.
With the cases published so far, RUMvision has demonstrated success in this approach, enabling detailed analysis and drawing broader conclusions about web performance.
</RUMvision>
Analysis
Thank you RUMvision! Now let’s look at the data.
To start, we’ll try to answer some basic questions about INP performance in the field. Later, we’ll dig deeper into some of the more advanced diagnostic metrics to try to understand the common reasons why INP performance can be slow.
How does INP perform?
We already have an idea of how INP performs, thanks to public data from the Chrome UX Report (CrUX). HTTP Archive tracks the percentages of origins having good and poor INP. An origin will be assessed as “good” if at least 75% of all experiences across all pages are less than 200ms–keeping in mind that INP only represents one of the slowest out of many interactions on a page.

Distribution of origins having good/poor INP (Sources: CrUX, HTTP Archive)
As of the November 2023 dataset we’re seeing 65.5% of origins having good INP on mobile and 3.7% with poor INP. On desktop devices, the same figures are 96.7% and 0.6%. It’s clear that there’s a significant challenge with INP on mobile devices.
One limitation of the CrUX dataset is that it doesn’t aggregate user experiences together across origins. We could try to use the coarse ranking information about each origin to try to better approximate the navigation-weighted percentage of experiences having good/poor INP–but that’s exactly what the RUMvision dataset can tell us!

Histogram of all navigations’ INP values (Source: RUMvision)
The INP histogram data from RUMvision shows us how fast individual INP experiences are, combined across desktop and mobile. Coincidentally, the percentage of navigations under the good threshold is exactly the same as the percentage of origins having good INP on mobile: 65.5%.
Because we know that INP tends to be especially bad on mobile, let’s split out these navigations by device type and group them by INP score.

Distribution of navigations having good/poor INP (Source: RUMvision)
According to the RUMvision data, only 51% of navigations on mobile have a good INP while 18% are poor. The situation is much better on desktop: 86% of experiences are good, and 5% are poor. To put it a different way, if you’re an average mobile user, your chances of experiencing a good INP are about 50/50.
While there will always be differences between CrUX and RUM datasets, it’s encouraging to see the RUMvision data corroborating the trends in CrUX where sites tend to struggle most with INP on mobile.
Let’s keep digging!
When does the interaction responsible for a page’s INP occur?
Now that we know how INP tends to perform, we can start to use RUMvision’s diagnostics to help explain poor INP values. One useful diagnostic is the time when the interaction responsible for the page’s INP occurs.

Distribution of the time at which INP occurs (Source: RUMvision)
For both desktop and mobile, there is almost a 50/50 split between interactions causing INP before and after the 10 second mark into the visit. More specifically, for INP on desktop, the interactions occur within the first 10 seconds 48% of the time, and after the 10 second mark 52% of the time. For mobile, it’s 42% and 58%.
10 seconds is also when we can generously expect most pages to have already finished loading. During that time there may be a lot of main thread work to initialize the page, like parsing markup and styles, compiling and executing JavaScript, and laying out the page. Beyond the 10 second mark, though, you wouldn’t expect the page to be busy doing much of any of that work at all. So it stands to reason that when an interaction is counted as the INP after 10 seconds, it would be less affected by main thread contention–and if there’s less contention, INP should be faster, right?

That’s not quite what we see if we dig a bit deeper into the data. When we look at how INP tends to perform when the interaction is before or after the 10-second mark, the earlier interactions have slightly better performance in aggregate. One possible explanation is that when a user stays on a page for longer, they also tend to interact with it more, so there are more chances to incur a slow experience.
Another clue may be in the long tail of the distribution. 15% of desktop and 17% of mobile navigations have their INP interaction occurring after 60 seconds. Sure, maybe some users are sticking around and engaging with pages after a minute, but another theory is that this segment is influenced at least in part by SPAs. As Erwin noted in an earlier post, INP can grow over the lifetime of a user’s session on an SPA. There is an experimental web platform API to correct for that, but RUMvision wasn’t using it in production at the time this data was collected. So it’s plausible that some of these late INP interaction times are the side-effects of soft navigations.
Where is the interaction time spent?
We now know that about half of all INP interactions on mobile are slower than 200ms–but where is that time being spent? The RUMvision dataset also includes additional diagnostic data to break down the INP time into three phases: input delay, processing time, and presentation delay.
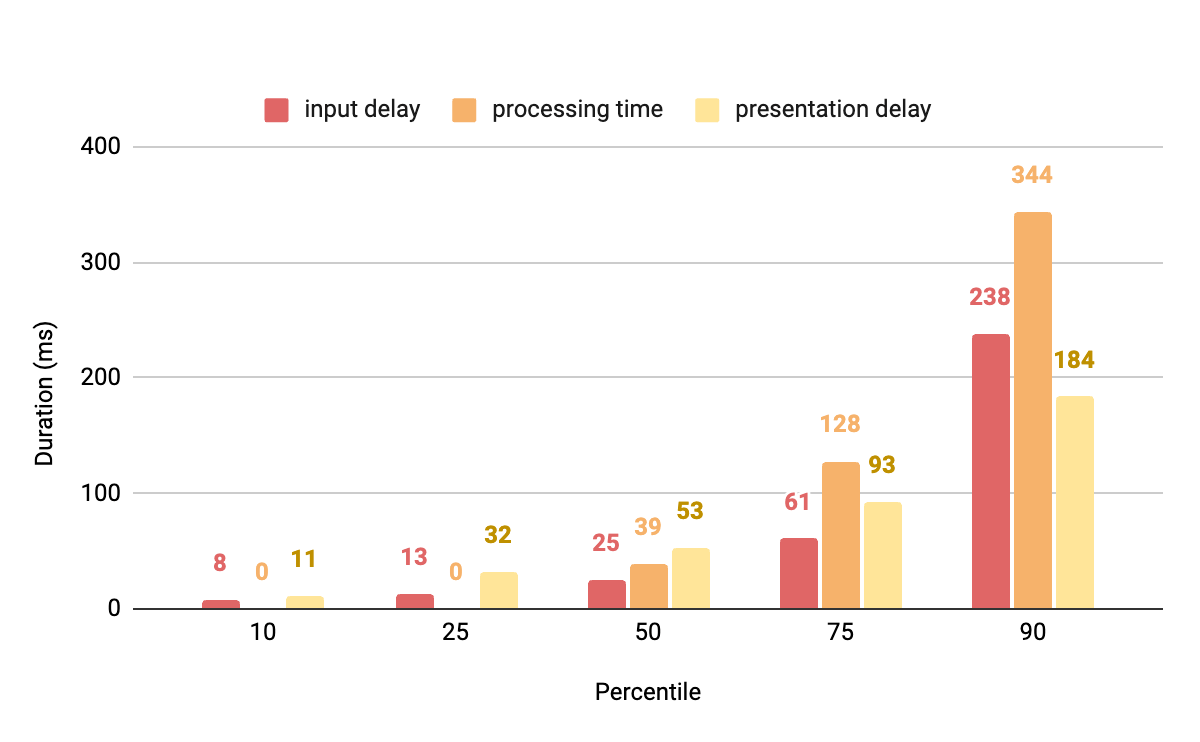
Independent distributions of INP breakdown metrics on mobile (Source: RUMvision)
The median value for each breakdown metric is 25ms of input delay, 39ms of processing time, and 53ms of presentation delay. We can’t exactly add these up and say that the median INP value is 25+39+53 = 117ms since each of these are independent distributions, but it does give us an idea of how much time is spent in each submetric.
The relative performance of these different phases is very different across the lower and upper percentiles. In the 10th and 25th percentiles, processing time is non-existent, meaning that at least 25% of INP values on mobile are the result of unhandled interactions. However, in the upper percentiles, processing time grows out of control very quickly: by 3.3x from the 50th to 75th percentiles and another 2.9x from the 75th to 90th percentiles, from 39ms to 128ms and 344ms respectively.
Similarly, input delay is another sleeper metric in the sense that it’s still relatively under control up through the 75th percentile, taking no longer than 61ms. But at the 90th percentile, we can say that 10% of INP values on mobile have an input delay of at least 238ms, blowing past the threshold for a good interaction. One possible explanation is that interactions with long processing times may be contributing to subsequent interactions’ input delays. For example, if a text input handler is not properly debounced, interactions may stack up each time a key is pressed.
Let’s make one adjustment to our analysis to only look at the distributions of INP breakdown metrics on mobile when the INP is slower than the “good” threshold of 200ms.
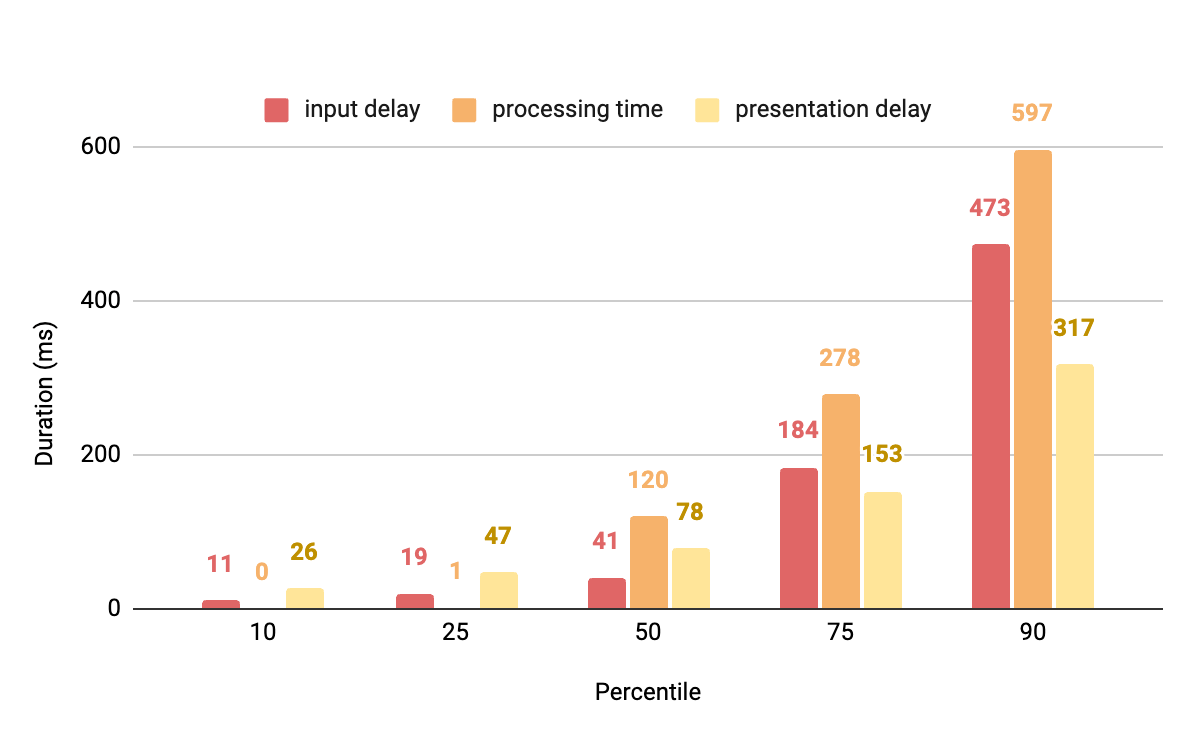
Independent distributions of INP breakdown metrics on mobile with slow INP (Source: RUMvision)
At first glance, it looks odd that some percentiles’ breakdown metrics don’t sum up to at least 200ms, but remember that these are independent distributions.
Now we can more clearly see that processing time is the dominant phase of problematic INP interactions. Half of them have a processing time of at least 120ms, which leaves very little time left over for any input or presentation delays.
What’s also interesting about these results is that even when INP is too slow to be considered good, no single breakdown metric stands out as being consistently slow across all percentiles. Each one always has at least 50% of navigations in which it’s not solely responsible for exceeding the 200ms threshold–but they all exceed it at some point. Input delay is longer than 200ms at the 90th percentile, processing time at the 75th percentile, and presentation delay at the 90th percentile. In other words, at least 10% of navigations with slow INP are always due to one or more of these breakdown metrics independently exceeding the 200ms threshold.
These results demonstrate the importance of task management strategies like yielding and deferring code execution to help drive down interaction delays and processing times on mobile. These results also show that presentation delay is solely responsible for slow INP performance at least 10% of the time, so rendering optimization techniques like reducing the DOM size and rendering less content on the client are still important.
Does it matter how good your device is?
One of the most fundamental tensions in computer science is the space-time tradeoff, which describes how algorithms with limited memory usage will take longer to perform a given task�compared to those that use more memory. Low-end mobile devices inherently have relatively small memory capacities, so by this principle, we’d expect to see degraded INP performance.

Distribution of mobile INP performance by device memory (Source: RUMvision)
These results show that devices with 8 and 4 GB of memory make up over 90% of the dataset, 2 GB devices make up 8%, and 1 GB devices make up less than 1%. Given the massive differences in sample sizes, it’s a bit hard to compare their INP performance. So let’s normalize it.

Normalized distributions of mobile INP performance by device memory (Source: RUMvision)
This is the same underlying data, but we’re just stretching each row proportionally. So for example, we can say that 55% of navigations on 1 GB mobile devices have a poor INP. And sure enough, as the memory class increases, the relative percentage of navigations with poor INP decreases. Devices with the most memory, capped by the API to 8 GB, only have 11% of navigations with poor INP.
The great thing about the open web is that a public website can be visited by anyone on just about any device. But to provide users on low-end devices with great experiences, it’s clear from the data that there’s a lot more we can do. The good news is that the INP optimization techniques that benefit users on low-end devices will also (to some degree) benefit those on high-end devices as well.
Who are the common culprits?
The last thing we’ll look at is script attribution from LoAF. The LoAF API gives us a way to identify animation frames that take longer than 50ms to render and see where that time is spent, down to the scripts that execute and who is responsible for them. Using this data, we can aggregate the most popular script hosts to see which ones tend to have the poorest INP performance. “Most popular” here refers to all hosts that make up at least 0.1% of the total navigations.

Distribution of INP performance by LoAF script attribution host (Source: RUMvision)
There are 41 distinct hosts that meet the popularity threshold. “www.googletagmanager.com” is the most popular, but we’ve sorted the chart from poorest to least poor, so it actually appears somewhere in the middle. The host attributed to the biggest proportion of poor INP experiences is “cdn-4.convertexperiments.com” from Convert, an A/B testing tool with the tagline “Optimize for better site experiences”. 60% of the 17k navigations that attribute the INP interaction to this LoAF host have experiences slower than the “poor” threshold of 500ms.
The second host from the top is “dashboard.heatmap.com” from Heatmap, which does exactly what you think it does. The website describes it as a way to “increase revenue faster with ecommerce metrics on every element, blazing-fast website speed, revenue-tracked Heatmaps, Scrollmaps, and Screen Recordings”. 55% of the 2k navigations with this host attributed to the INP interaction have poor INP.
The third host is “cdn-swell-assets.yotpo.com” from Yotpo, which is an “eCommerce retention marketing” platform. 42% of the 12k navigations attributing INP to this host have poor INP. For what it’s worth, “staticw2.yotpo.com” also shows up on this list and only 16% of its 4k navigations are poor.
Many of the other hosts in this list�are not so easily recognizable, so let’s group the results by the category of services that they provide.

Distribution of INP performance by LoAF script attribution category (Source: RUMvision)
The top three categories attributed to the largest proportion of slow INP performance are A/B testing, user reviews, and user behavior. 56% of the navigations whose INP is attributed to a script in the A/B category have poor experiences. This category only has two hosts in it: Convert, which we’ve looked at before, and “dev.visualwebsiteoptimizer.com”. The latter does pretty well on its own at 57% good INP, but it’s in poor company. The user reviews category is 35% poor and consists of the two Yotpo hosts above. And the user behavior category is 29% poor consisting of a few hosts: dashboard.heatmap.com (55% poor), script.hotjar.com (33% poor), cdn.noibu.com (20% poor), and www.clarity.ms (11% poor).
Conclusions
There’s so much more in this dataset that we haven’t explored yet, but even from this brief analysis, we’ve learned a lot about how INP performs in the field and some of the most common ways it can slow down the user experience.
- We looked at the distribution of INP experiences on desktop and mobile and corroborated the CrUX dataset findings that mobile experiences tend to struggle more with INP.
- We looked at when the interaction responsible for the INP happens and found a 50/50 split around the 10-second mark, with the interactions happening earlier performing slightly better.
- We broke down the interaction time into its phases and found that processing time quickly becomes the most problematic area, but either of the other phases can also be disastrous for INP performance at least 1 in 10 times.
- We saw the degree to which device memory plays a role in INP performance, with low-memory devices performing 5 times worse than high-end devices.
- We explored how often the most popular script attribution hosts from LoAF are associated with poor INP performance. Third-party scripts that do A/B testing, user reviews, and user tracking tend to perform the worst.
While many of the takeaways here apply mainly to the web as a whole, there are also some lessons for individual site owners who may be struggling with their INP performance. Most importantly, RUM data is critical to understanding how poor the user experience may be and how to improve it. If your website is in the CrUX dataset, it can tell you how slow your INP is, but not why it’s slow. Collecting diagnostic metrics in the field like interaction time, delay and processing phases, device memory, and script attribution paints a more complete picture of the user experience and offers clues as to how to improve it.
This analysis also shines a light on where INP time tends to be spent, and what kinds of optimizations would be most commonly needed to optimize it. It’s no surprise that task management strategies like yielding play a central role in improving INP performance, but now we have a much better idea of the extent to which it matters. Even though the presentation delay might not always be where most of the interaction time is spent, it’s still problematic in many situations, and some sites will need to invest in reducing their DOM complexity and curbing their client-side rendering to get their INP under control.
INP is still a relatively new metric and many developers are just starting to look at it for the first time as it gears up to become a Core Web Vital metric in March 2024. If that’s you, the best place to start learning about optimizing INP is definitely the INP docs on web.dev. As you become more familiar with it and start to make some improvements to your own site’s performance, consider sharing your wins with the community in the form of a case study or blog post. Seeing how it’s actually done is a great way to demystify the unfamiliar.