
Brian Louis Ramirez (@screenspan, @screenspan@mastodon.green) is a web performance engineer at Speed Kit.
INP by Page Type
At Speed Kit, we accelerate over 1,400 mostly e-commerce websites around the globe (see how Speed Kit works) and collect real-user data for validation in A/B tests and performance monitoring.
We collected Interaction to Next Paint (INP) values on 780+ e-commerce websites this year, and I’d like to share with you the results of a little analysis I did for October 2023.
While we didn’t collect attribution data at that time, we track data by page type, which allows us to see how different each type (i.e. product page, category page, etc.) performs in terms of responsiveness.
Key Findings
Home and Category Pages Have the Most Occurrences of Sub-Par Responsiveness
Our October RUM data shows: users most frequently experienced poor responsiveness on homepages and product category pages.
| home |
|
|---|---|
| category |
|
| product |
|
| search |
|
| other |
|
| checkout |
|
Category Pages on Mobile Have the Worst Responsiveness at the 75th and 90th Percentiles
Unlike the previous comparison of INP occurrences, the following comparison shows how bad responsiveness is at the slowest end of the spectrum.
If we have a look at INP at different percentiles, eCom category pages on mobile have the worst values at P75 and above.
At the 75th percentile, INP is around the 1-second time limit for users to maintain a seamless flow of thought.
At the 90th percentile, INP on category pages is a mind-numbing >2.5 seconds, which is around a half a second slower than on homepages.
| INP p25 | INP p50 | INP p75 | INP p90 | INP p95 | |
|---|---|---|---|---|---|
| category | 128 | 296 | 960 | 2523 | 3839 |
| home | 160 | 336 | 800 | 1979 | 3263 |
| search | 128 | 240 | 624 | 1880 | 2999 |
| product | 128 | 264 | 584 | 1312 | 2111 |
| checkout | 112 | 216 | 520 | 1112 | 1689 |
| other | 120 | 232 | 480 | 1080 | 1915 |
That begs the question: what is it about category pages that leads to such poor INP times?
Common INP Problems on Category Pages
Since we didn’t have INP attribution tracking at the time of the analysis, I manually audited sites with the worst INP on category pages and spotted several common patterns.
1. Filtering Leads to Route Changes and Long Tasks
Product filters are common to most category pages and a key feature for users to find the product(s) they are looking for.
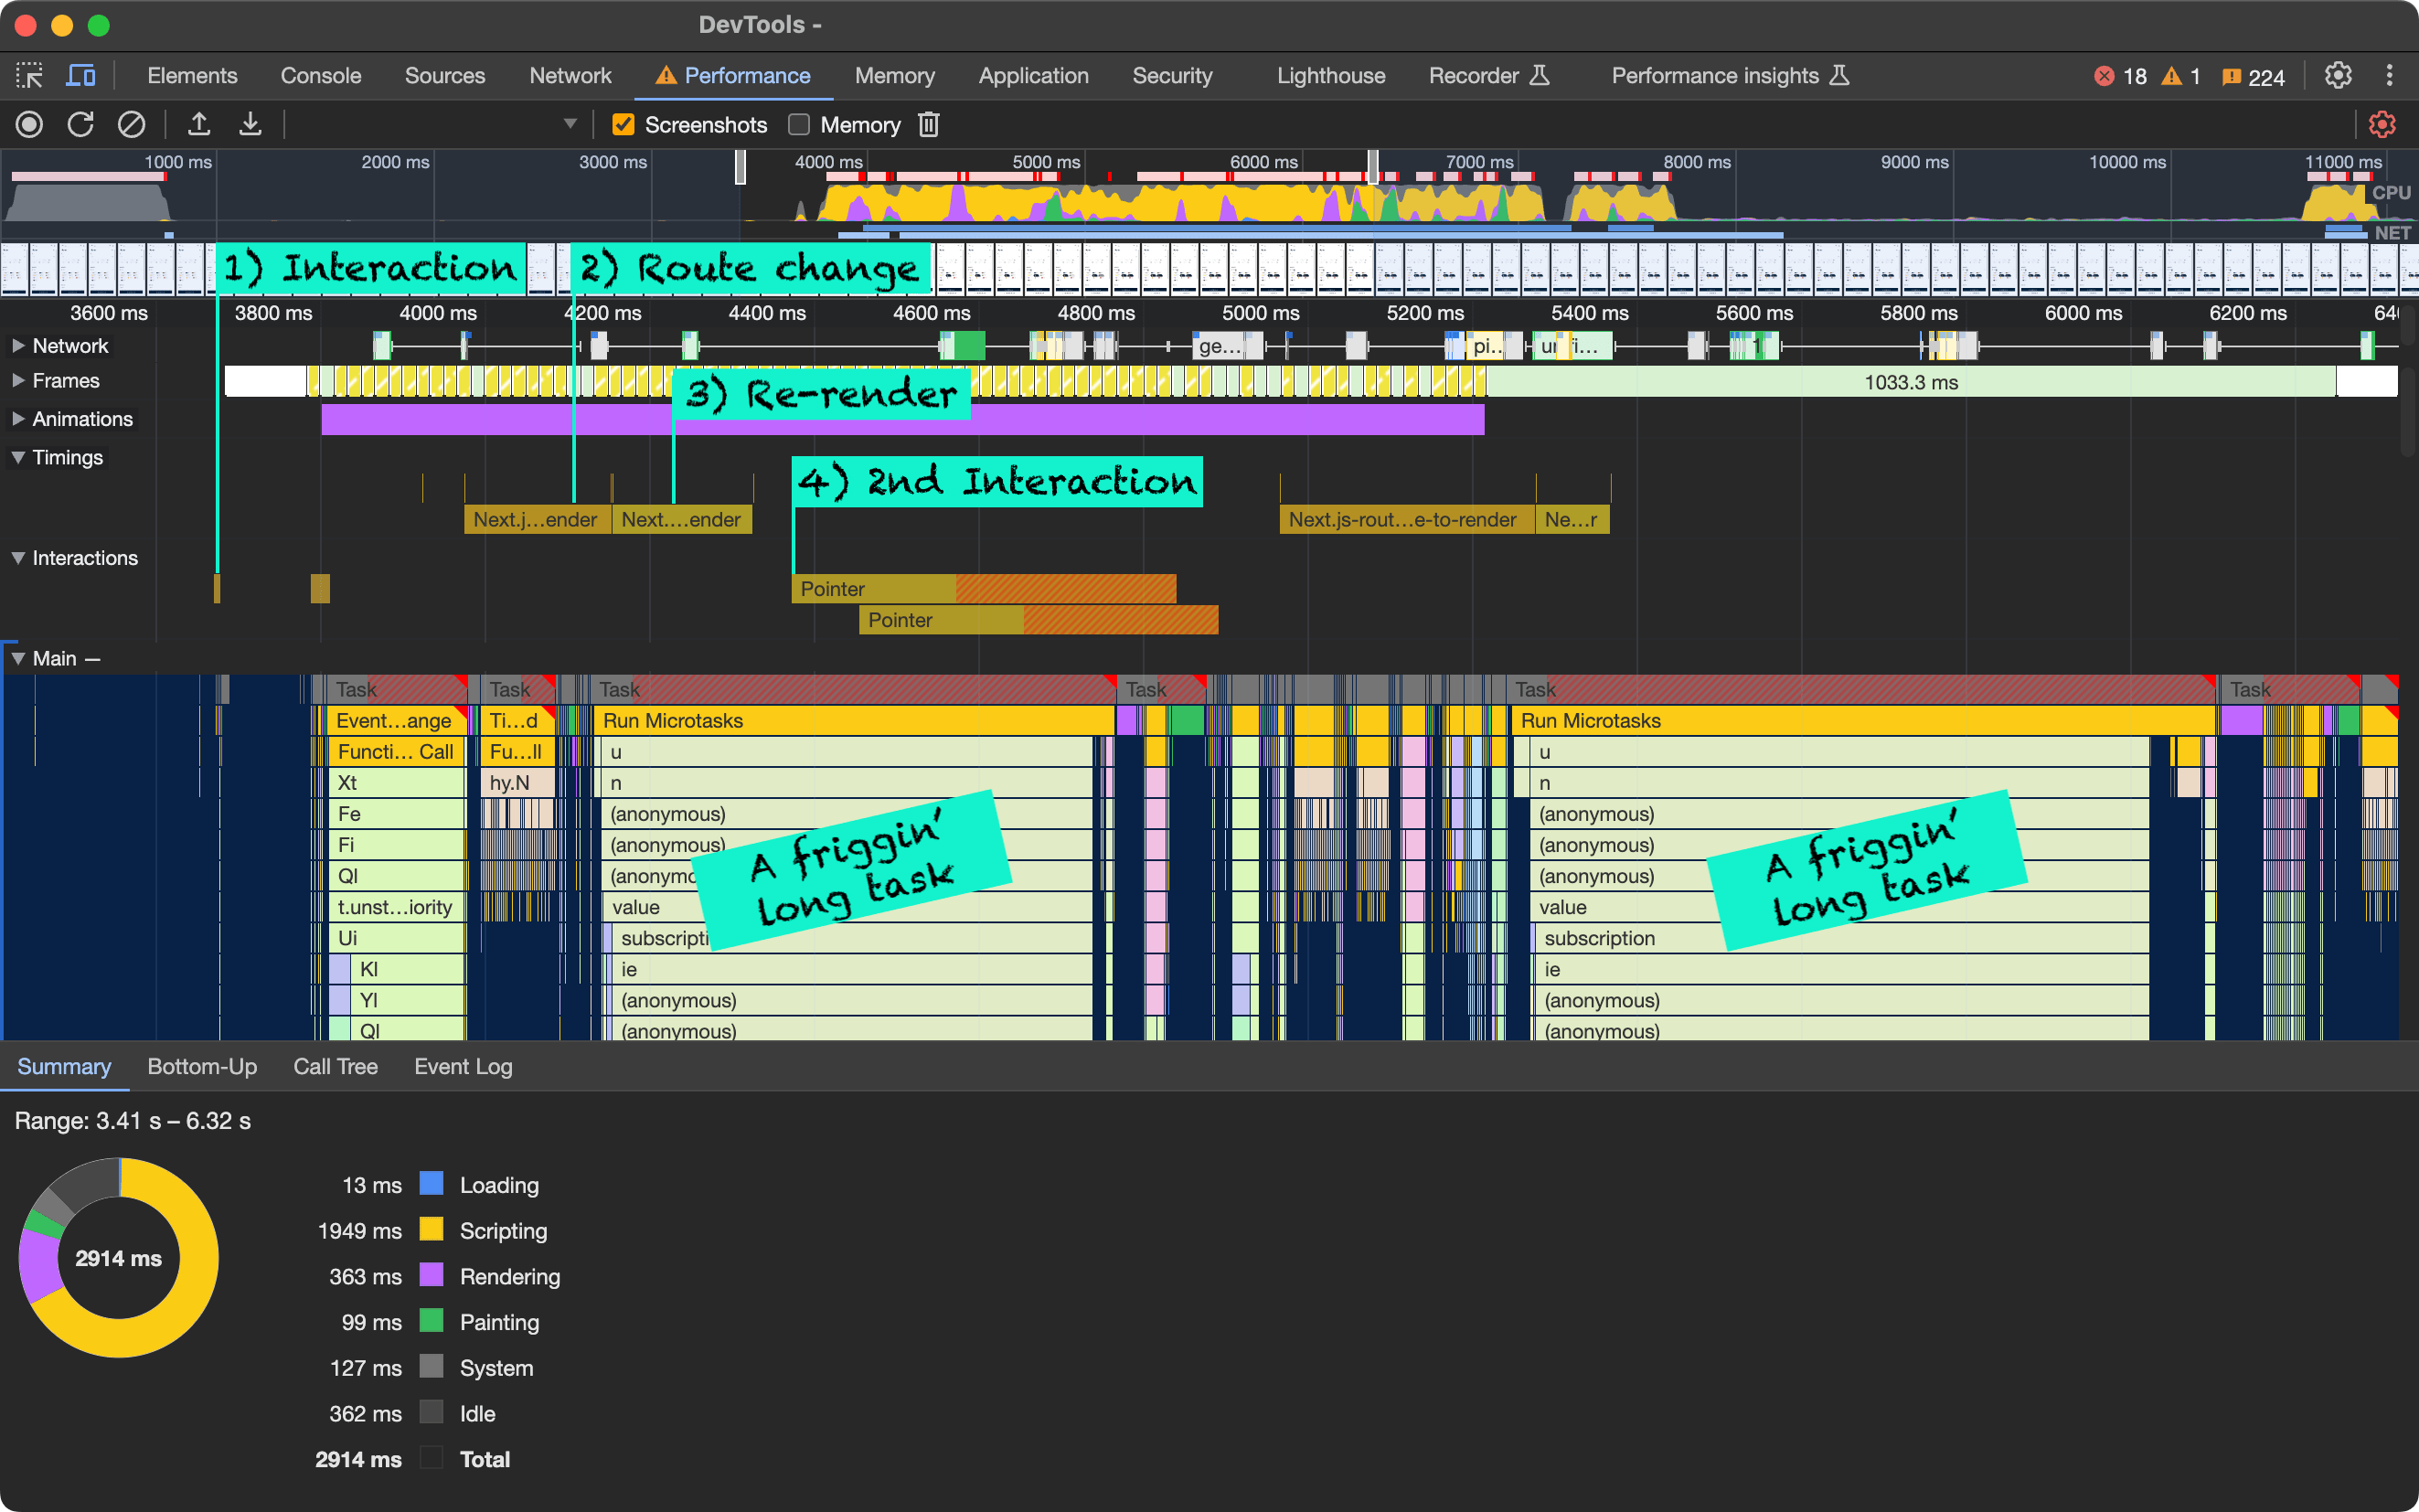
On sites with particularly poor INP on category pages, I found that selecting filter options was a performance bottleneck: selecting an option triggered a soft navigation, e.g. from example-musicstore.com/guitars to example-musicstore.com/guitars?color=naturalblonde, and a series of long tasks that blocked rapidly selecting multiple options.
Example
On one site, multiple filter options are visible on mobile. And a big button at the bottom of the filter shows how many articles there are after applying the filter.
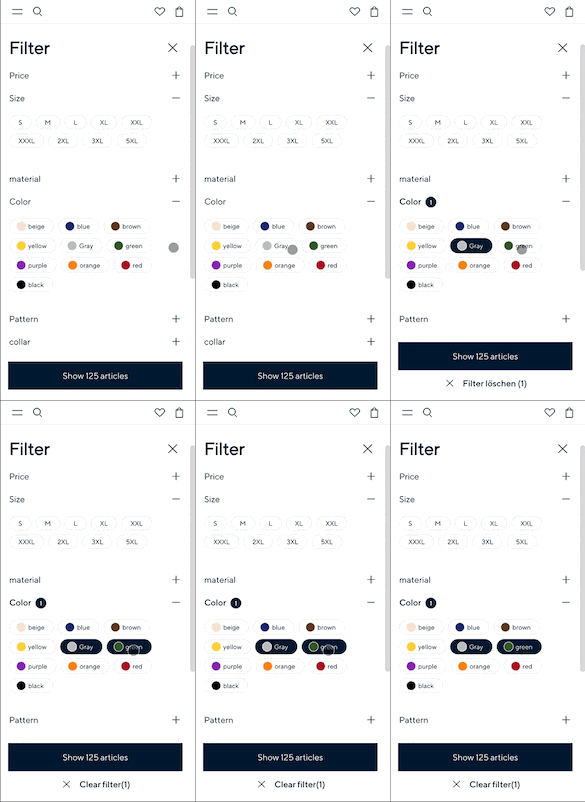
The problem was: every time that I selected a filter option, a route change was triggered followed by a very long task for re-rendering work that blocked a successive interaction.
I found another UX pattern common to category pages with sluggish responsiveness: sub-category links. While they ideally provide better UX by giving users a faster way to navigate to a sub-category, switching between sub-categories gets bogged down due to networking and processing work in between.
Possible Solutions
- When the user selects a filter option and causes a re-routing, show a single loading spinner upon interaction (and consider preventing further interactions) until routing and rendering is complete
- Consider re-working filter UX so that the user must click a button to apply all selected filter options
2. Perf Problems in a Single Product Tile Get Compounded on Category Pages
On the sites with poor INP on category pages that I audited, some had very complex product tiles with:
- too many or deeply nested child nodes (see Lighthouse guide)
- multiple images for product variants in a single tile
- too many interactive elements in a tile, e.g. for changing product variants
- “personalized” product suggestions dependent upon complex logic
- excessive animation
Example
One site displayed a loading spinner in each product tile that was not fully loaded:

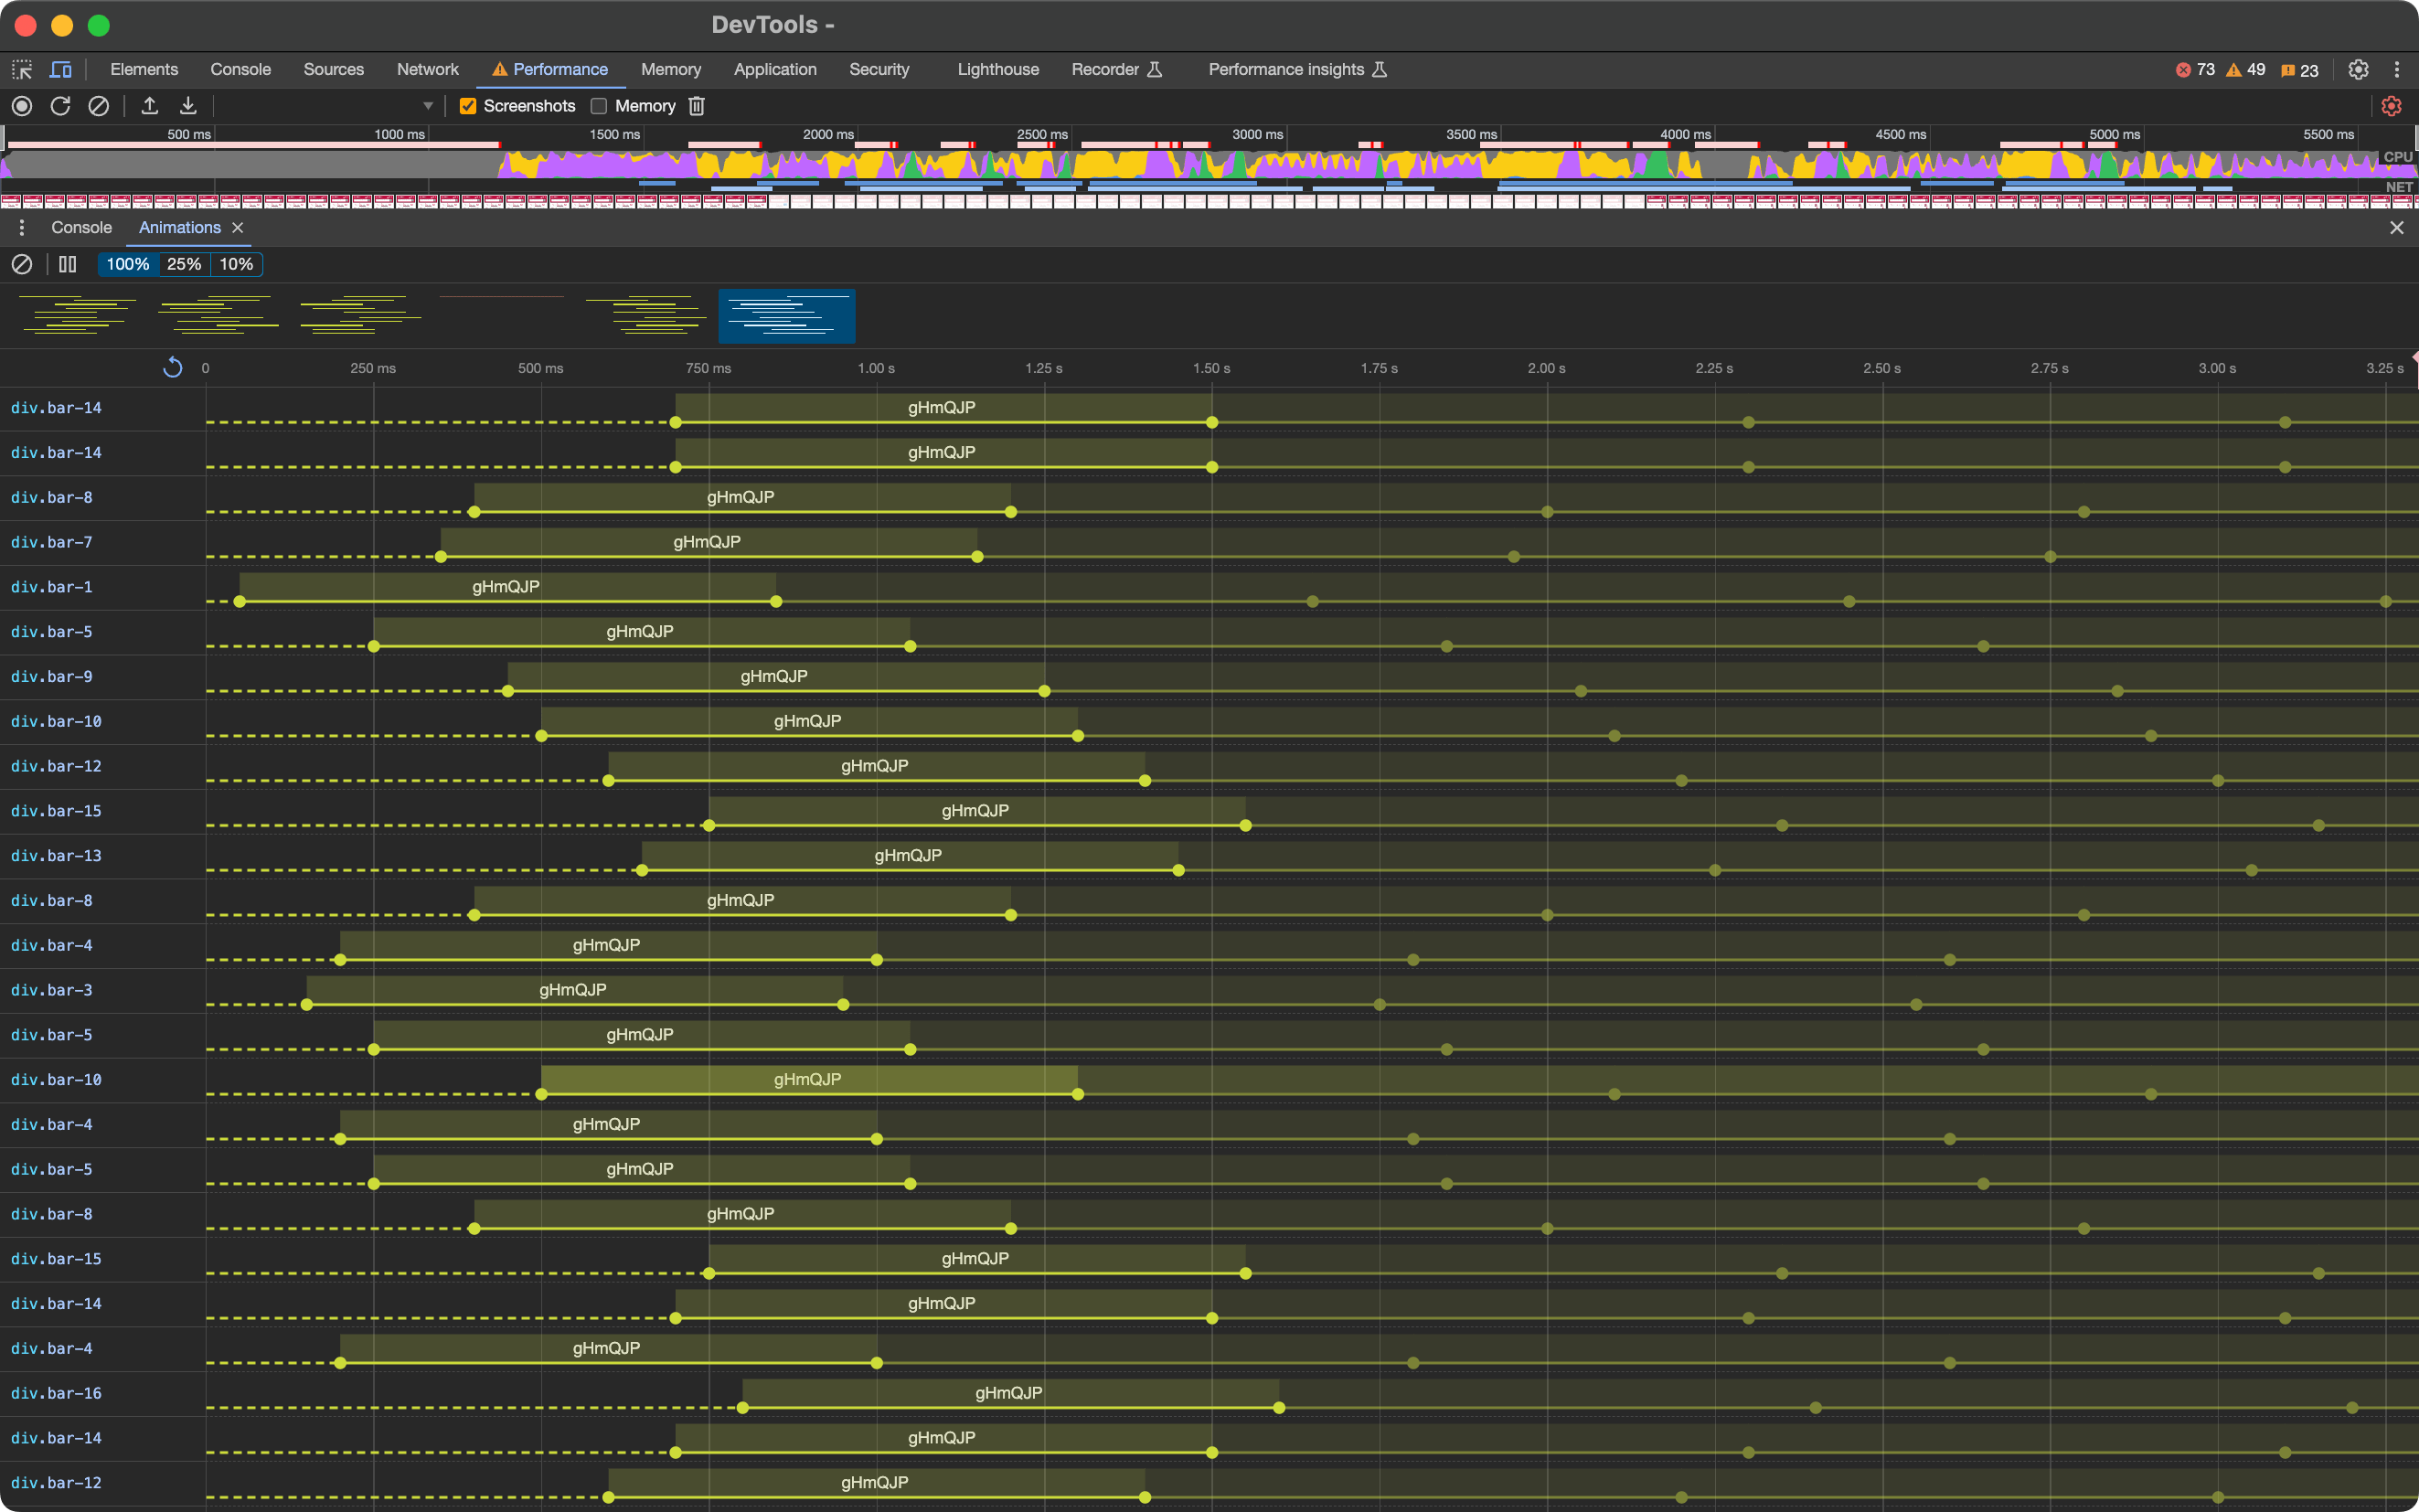
The problem was: instead of animating the spinner as a whole and only when visible, each individual bar in the spinner was animated whether visible or not. And so that problem compounded with each product tile on a category page.
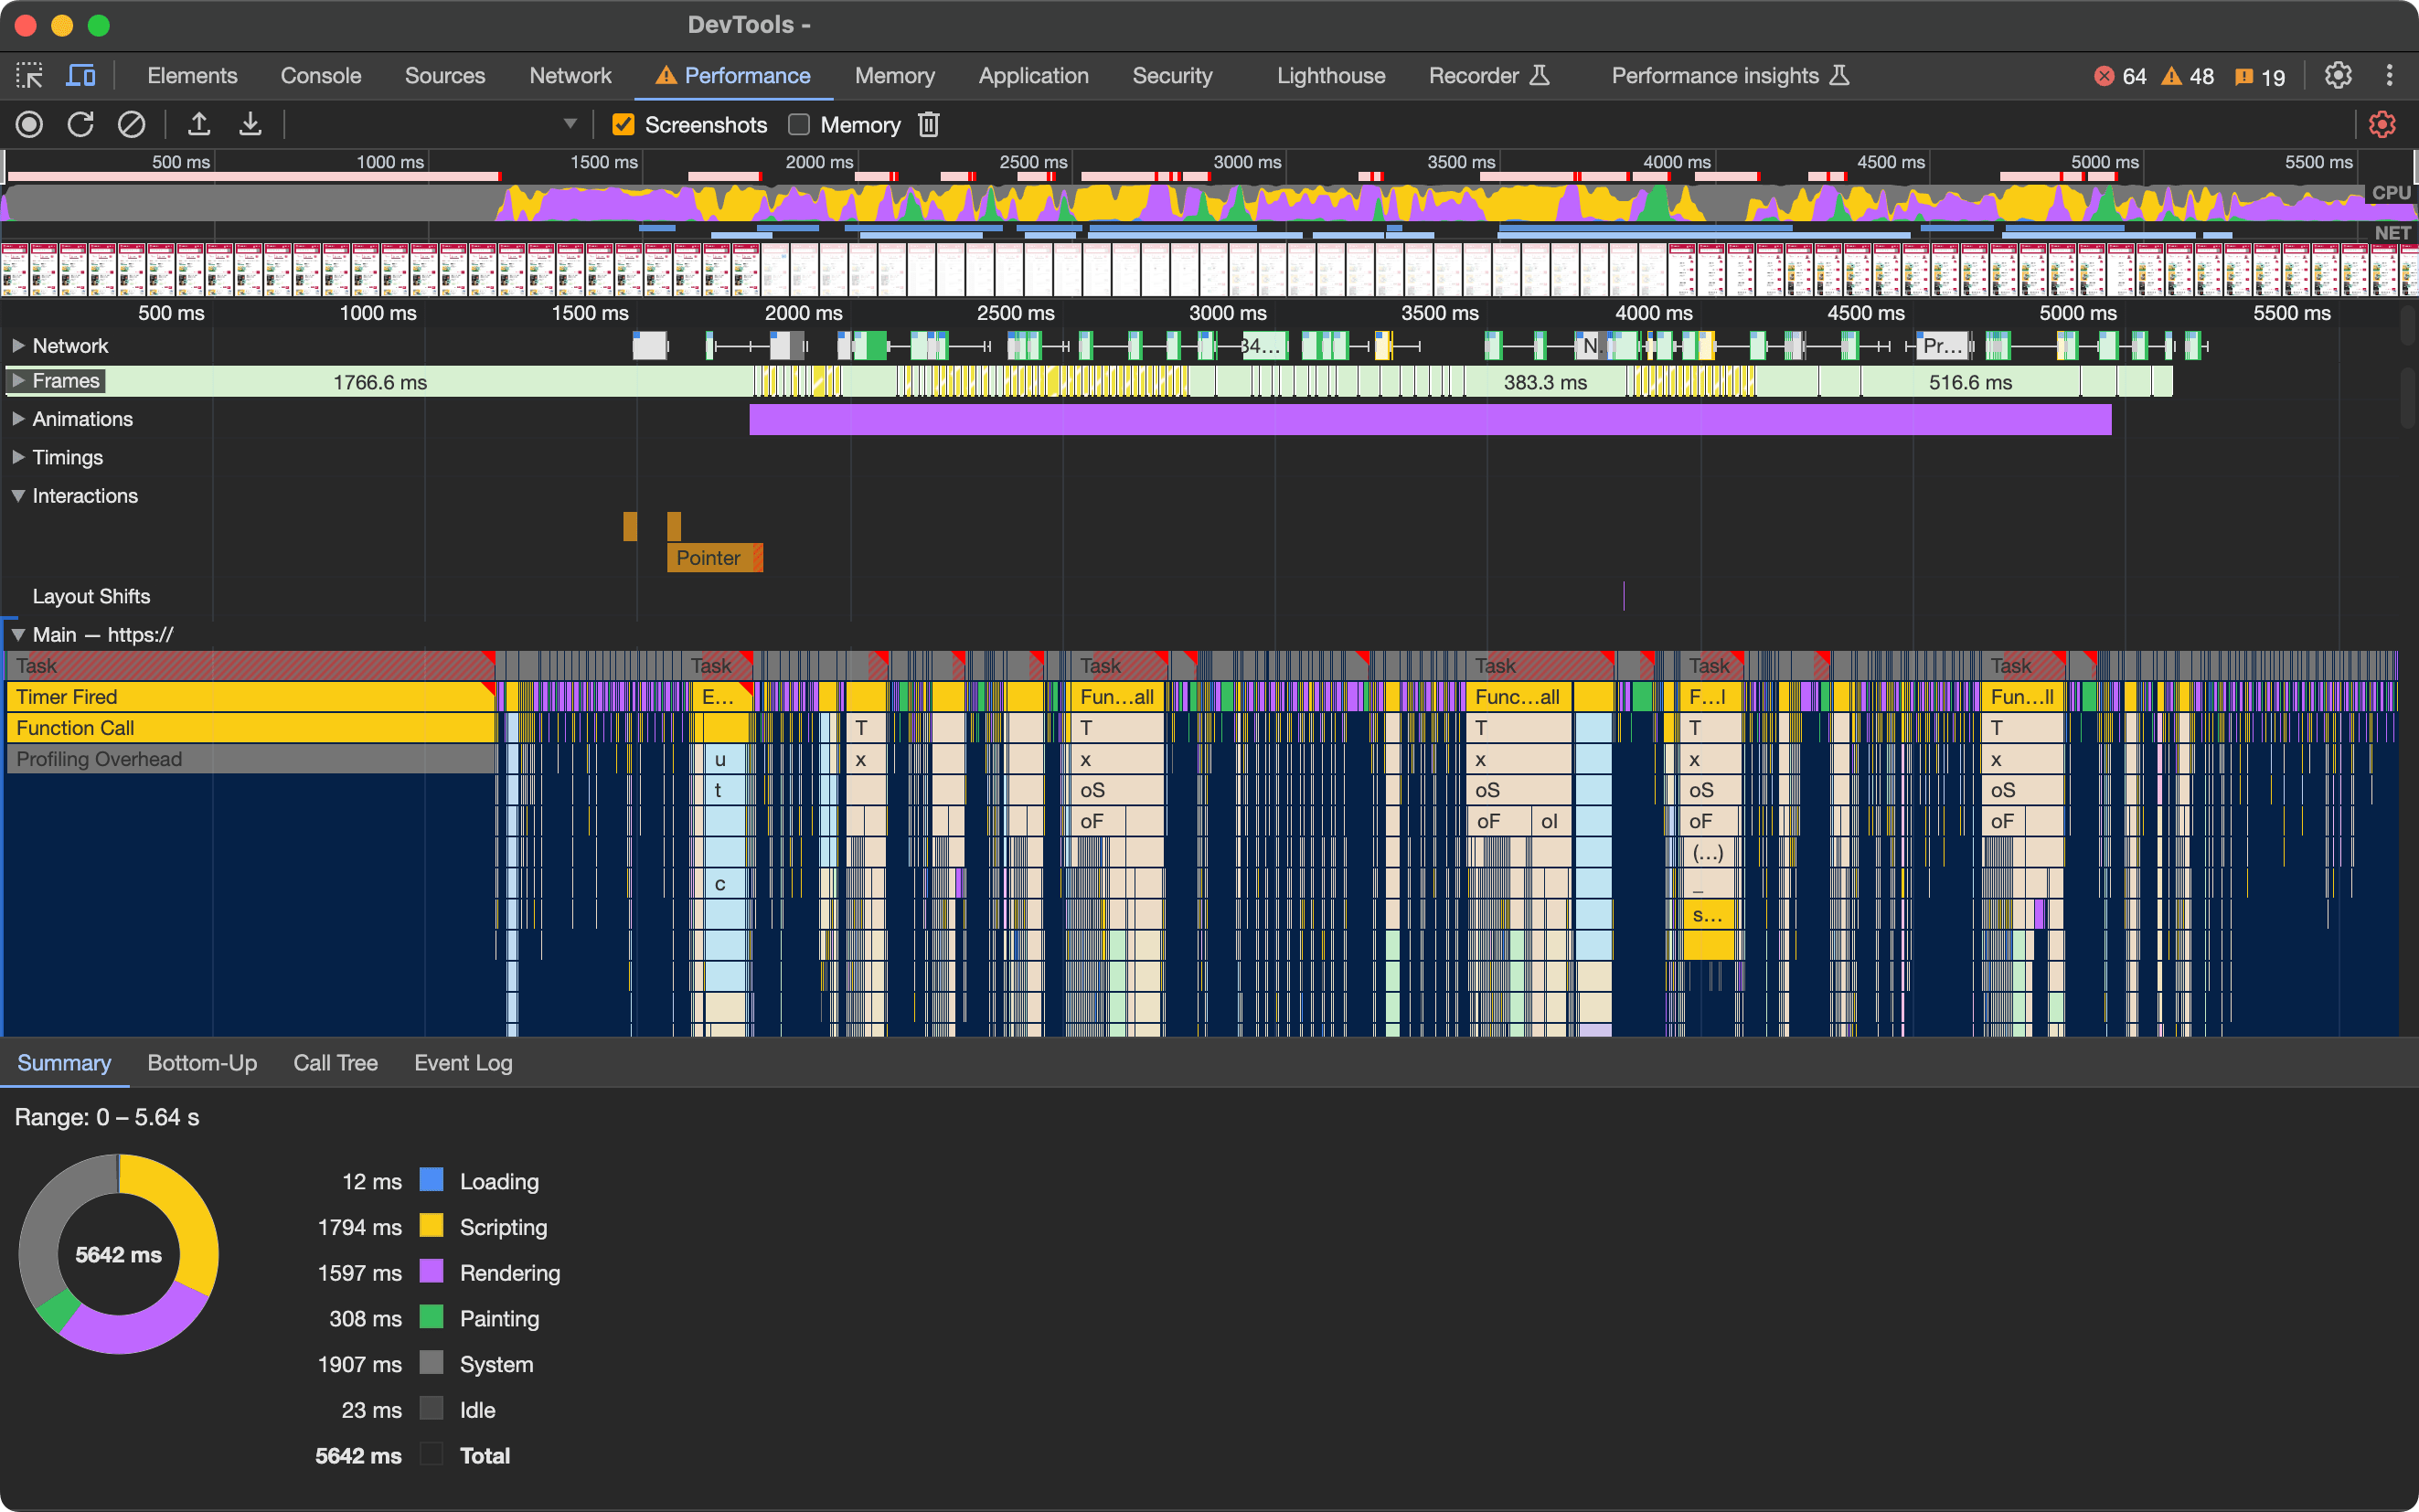
Expanding the Animations lane in the performance trace shows just how much rendering work is performed. I found some 330+ individual spinner bars are animated when soft-navigating from one category page to another.
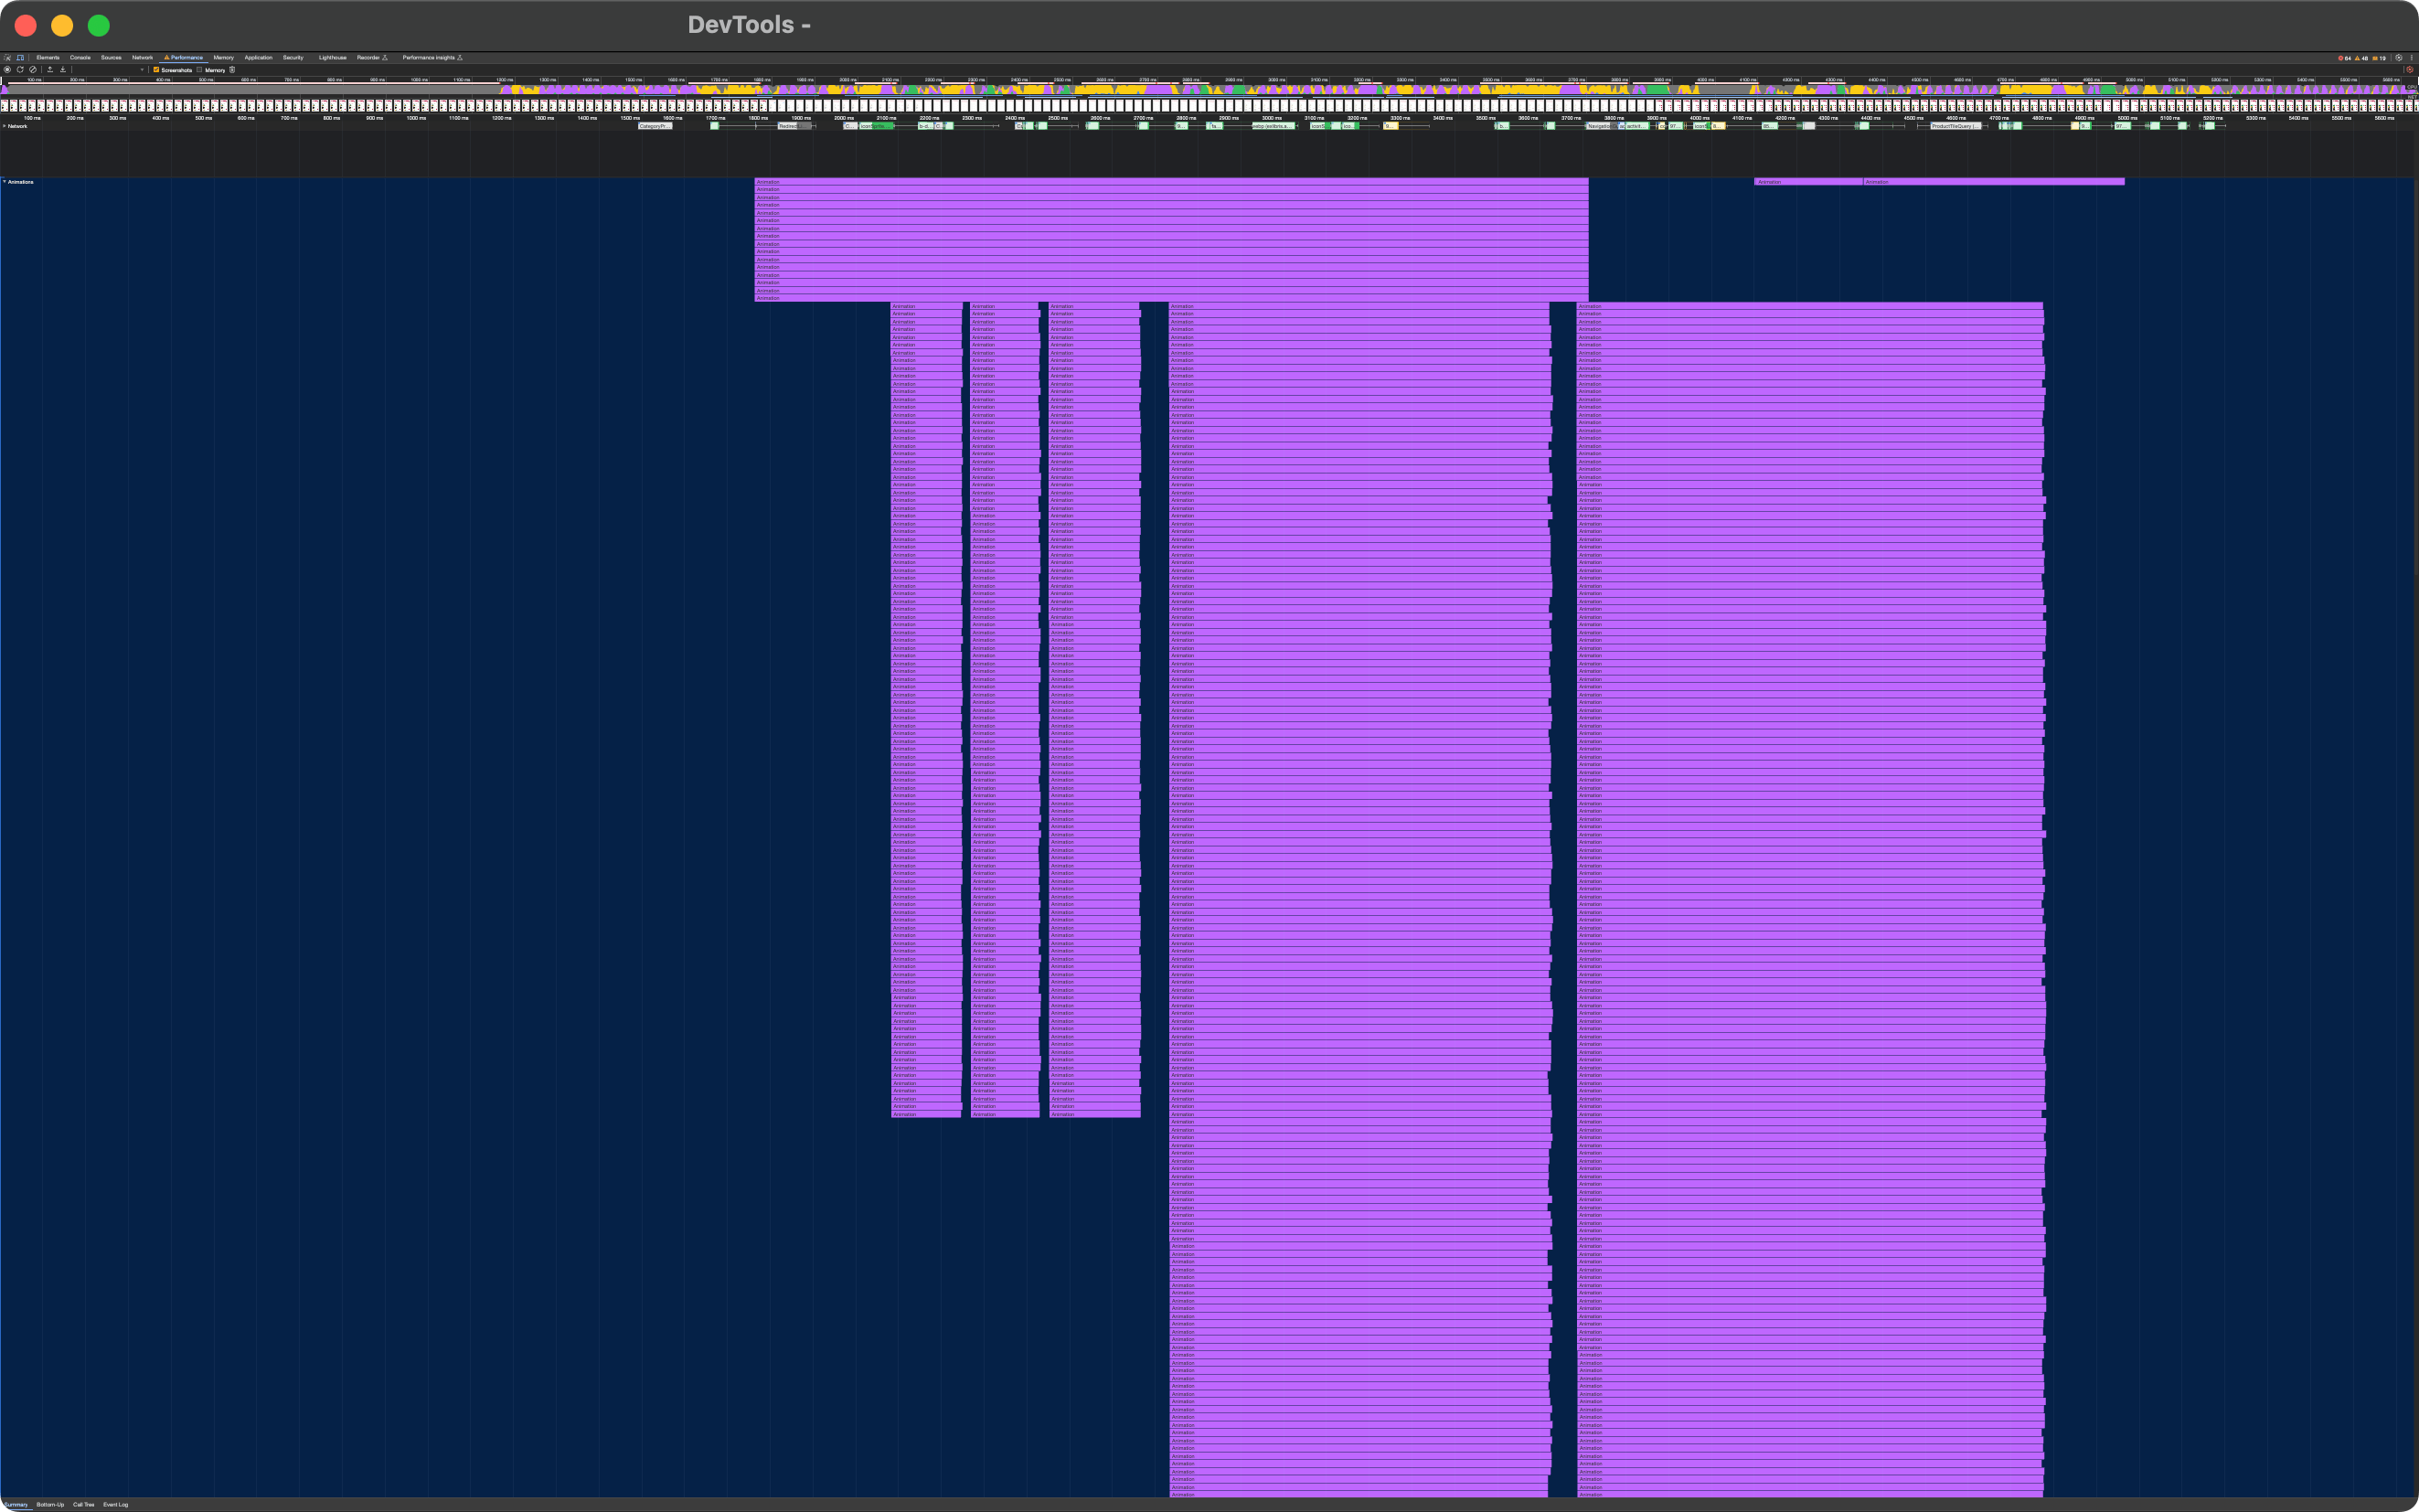
A quick look at the Animations panel also reveals the extent of the damage done when a performance problem on a single product tile gets compounded.
Possible Solutions
- Reduce tile complexity removing functionality that may only work best on desktop
- Flatten the nodes in a tile and use semantic HTML
- Avoid animating elements that are outside of the viewport, e.g. “skeleton” loading or spinners
- Lazy-load product tiles if they’re rendered using a JavaScript framework like React or Angular
- If tiles are server-side rendered, use CSS containment or
content-visibility: autoto reduce the amount of initial rendering work (as long as you’re not forcing reflow on the tiles)
3. Additional Overhead from Tag Managers and Third-Party Code
All of the sites I audited that had poor INP on category pages had another thing in common: lots of third-party code loading via tag managers.
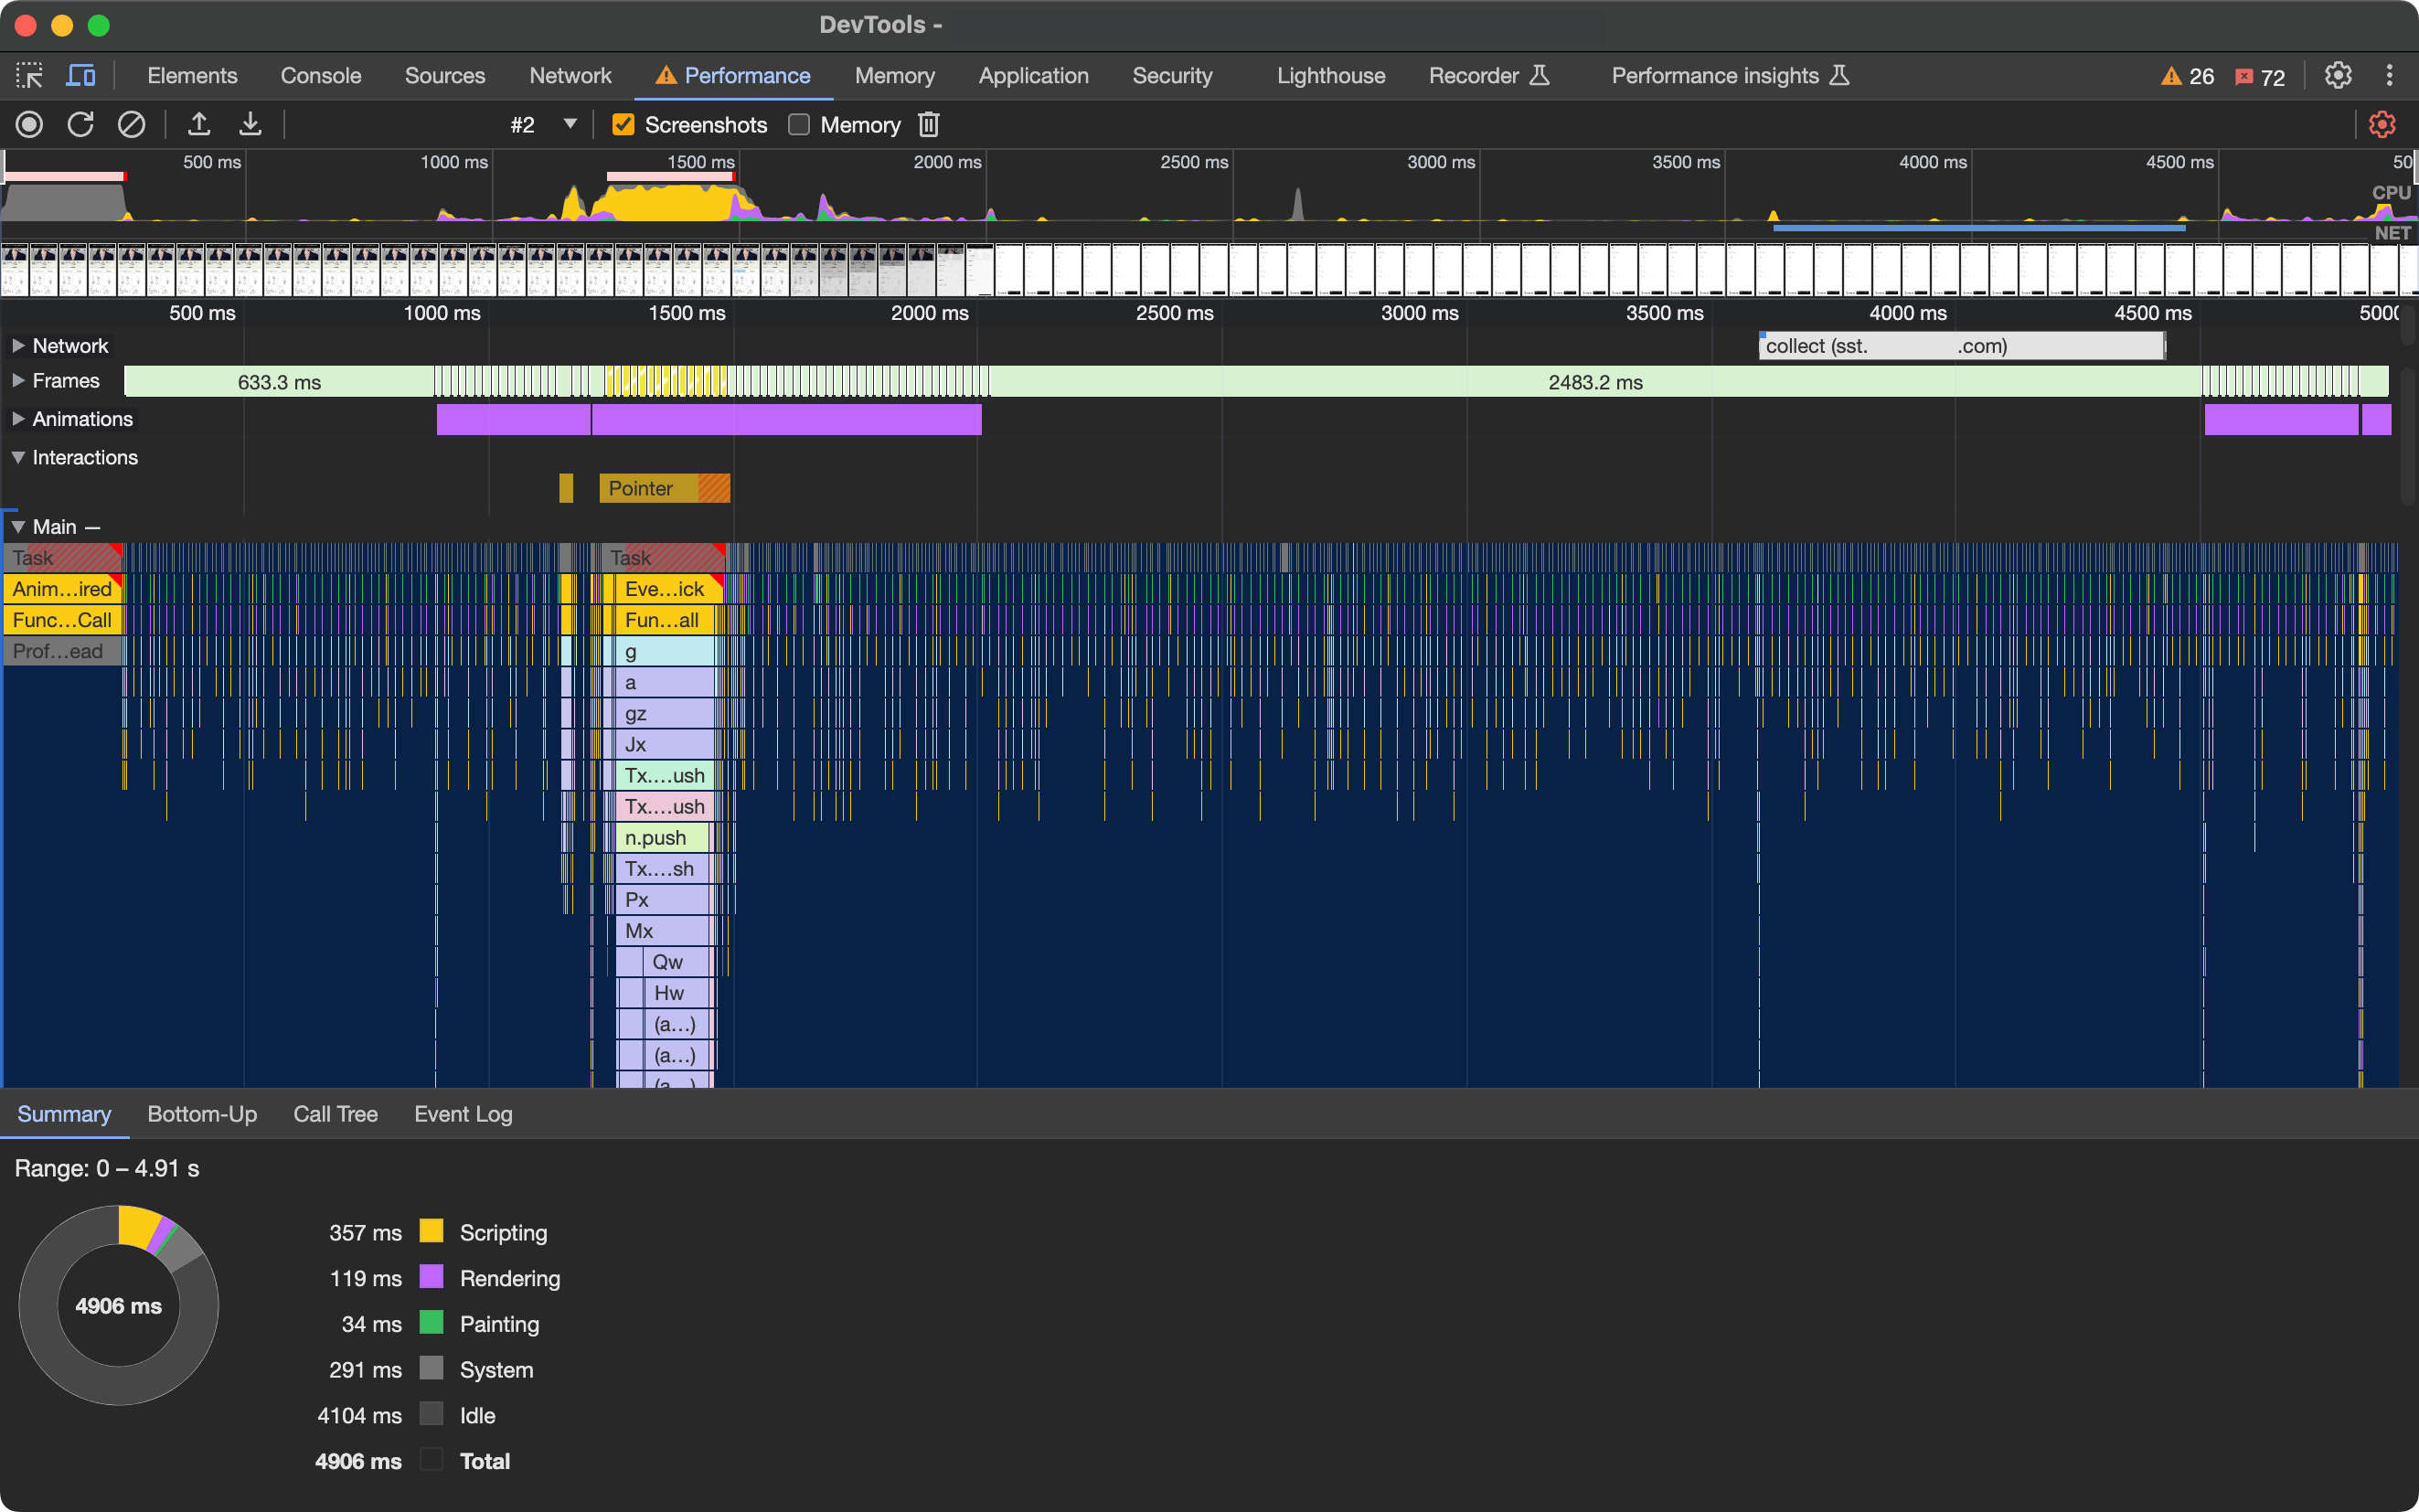
I could easily see the effects of third-party code on sites with cookie banners by first visiting the site and then rejecting cookies once the cookie banner appeared. Then I ran a performance trace with 6x slowdown and a hardware concurrency of 4 and clicked a single element on a category page (e.g. on a button to open filter options) on mobile.
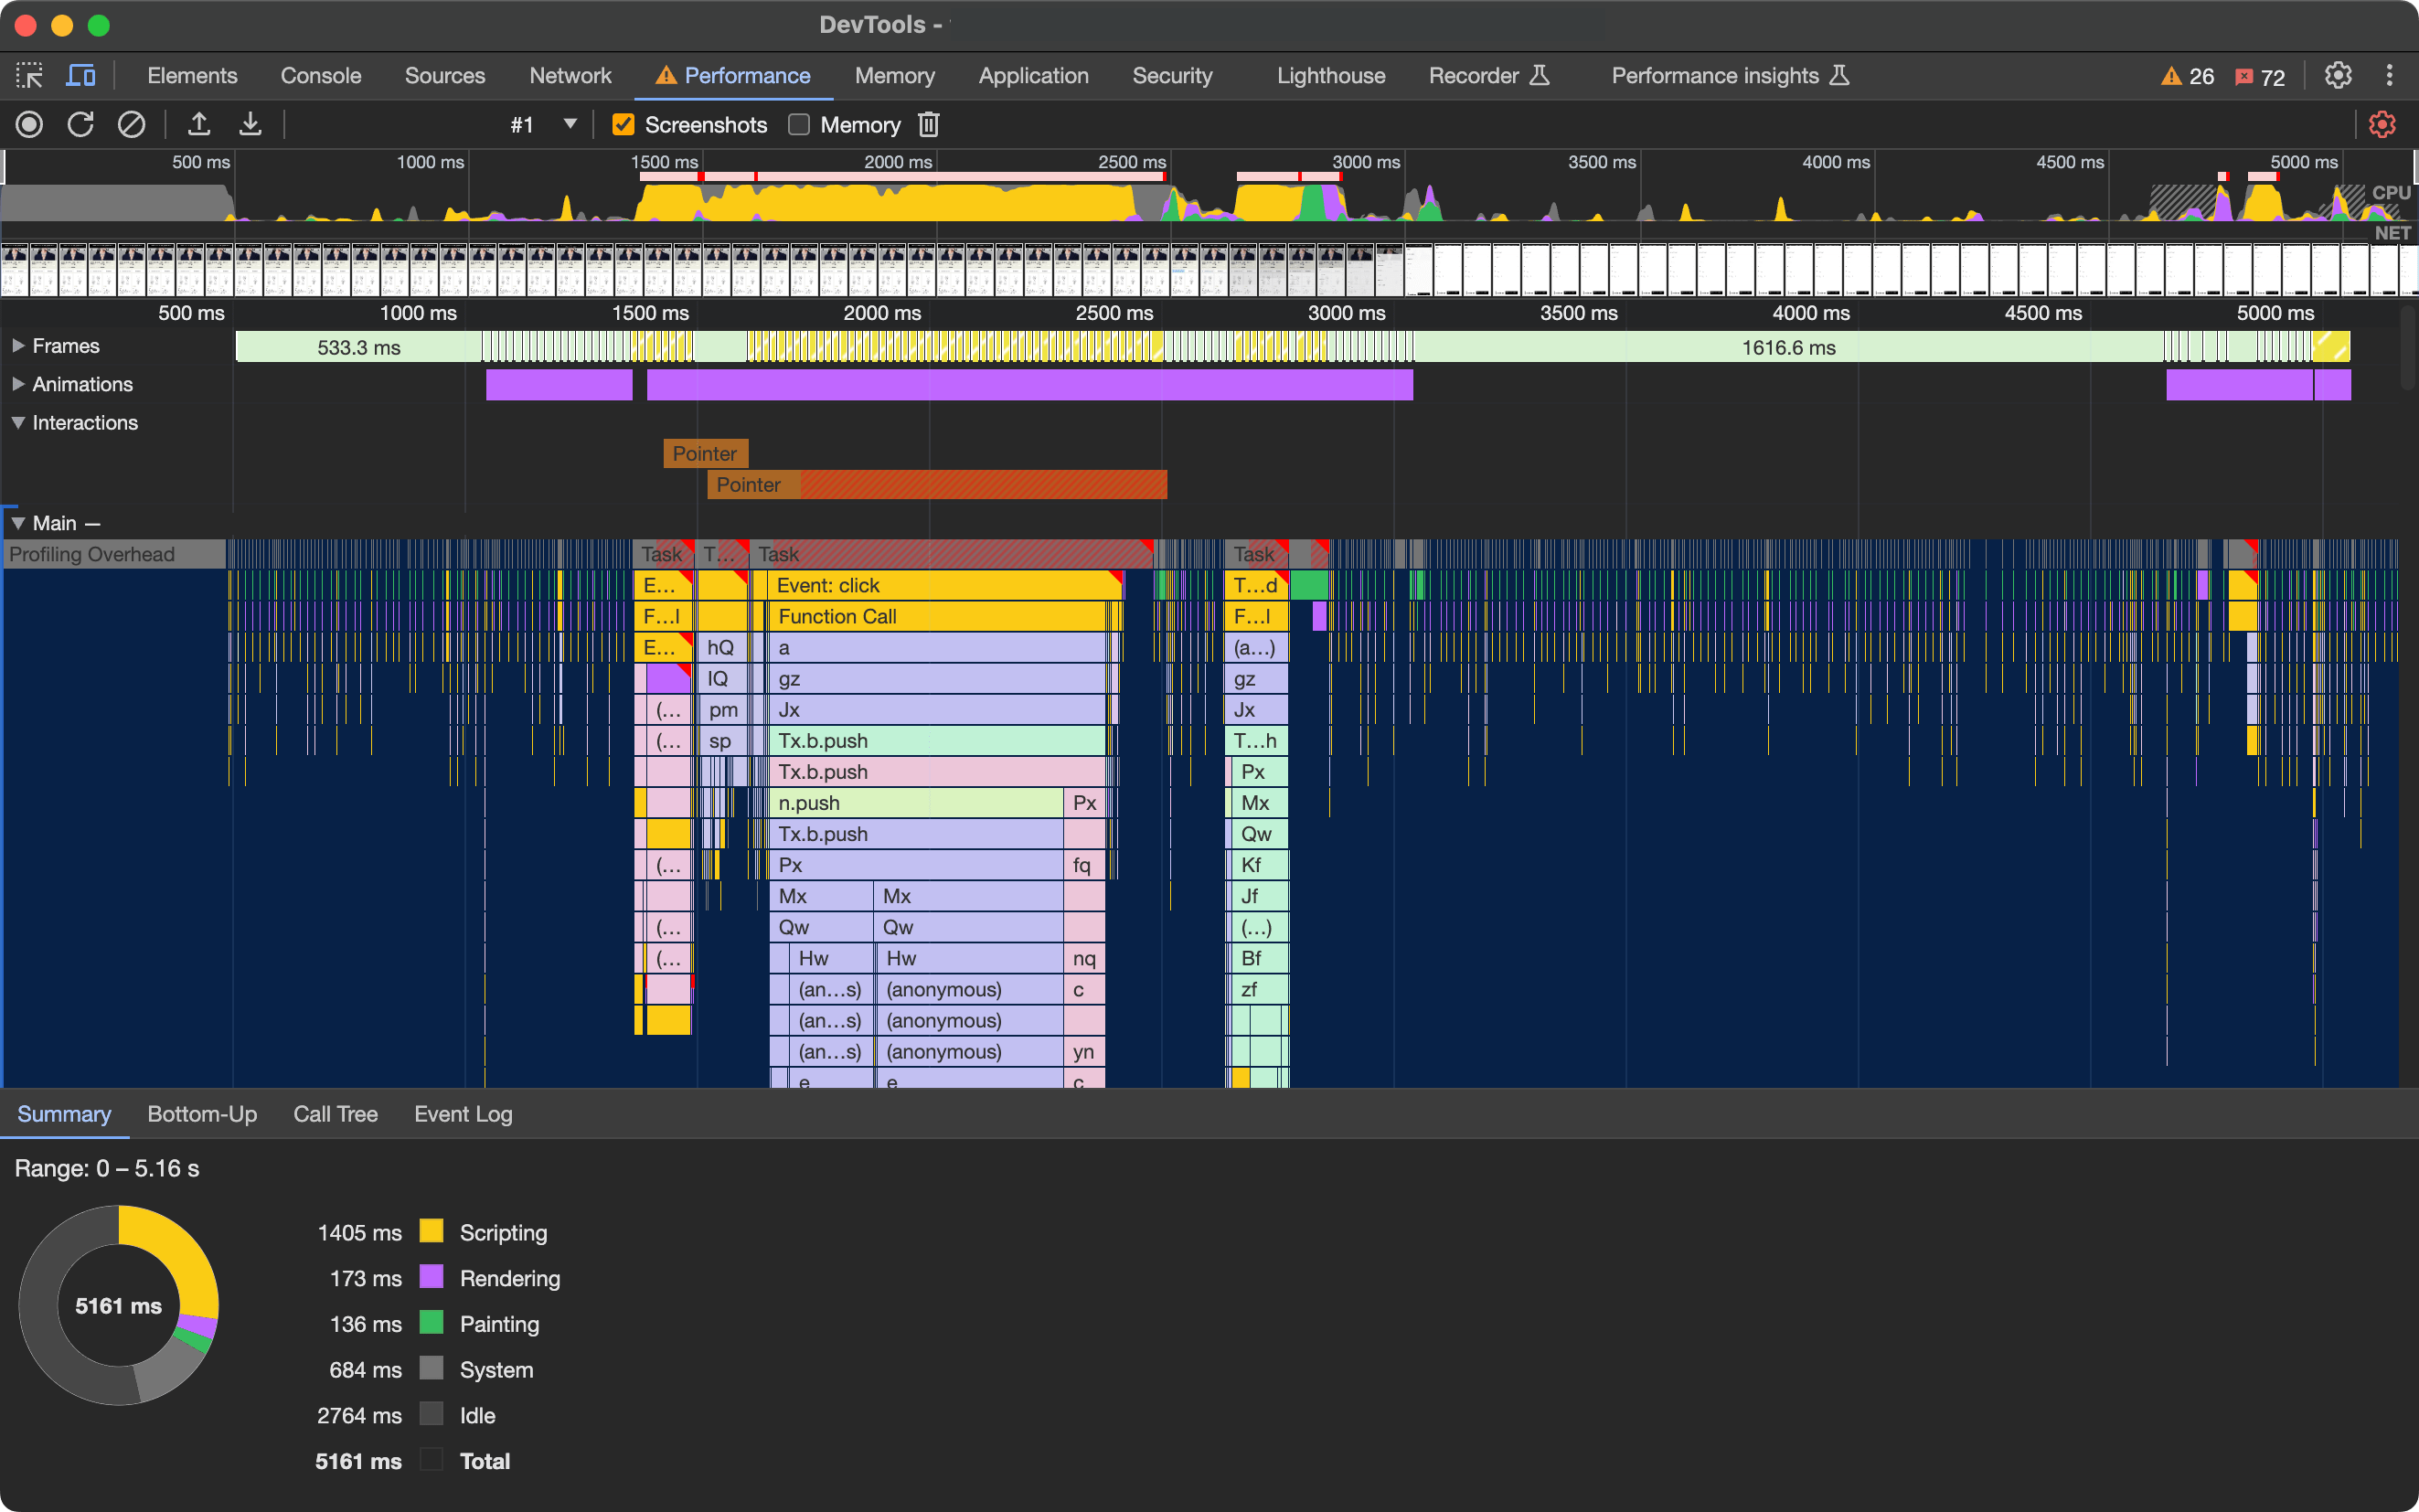
Then after clearing site data, visiting the site and accepting cookies, I would run a comparison trace with the same single interaction. It generally showed much longer and multiple long tasks upon interaction.
There are several ways to slow down a site’s responsiveness with tag managers:
- Using more than one tag manager or containers
- Loading a tag manager in a synchronous, blocking manner
- Using custom HTML tags with poorly performing code
- Having too many click or timer triggers
- Loading tags with poorly performing code
Example
On one site that I first visited, I noticed the function a(b) in this snippet from Google Tag Manager was an INP bottleneck:
// Before
function a(b) {
    var c = b.target;
    if (c) {
        var d = yy(c, "gtm.click");
        gz(d);
    }
}
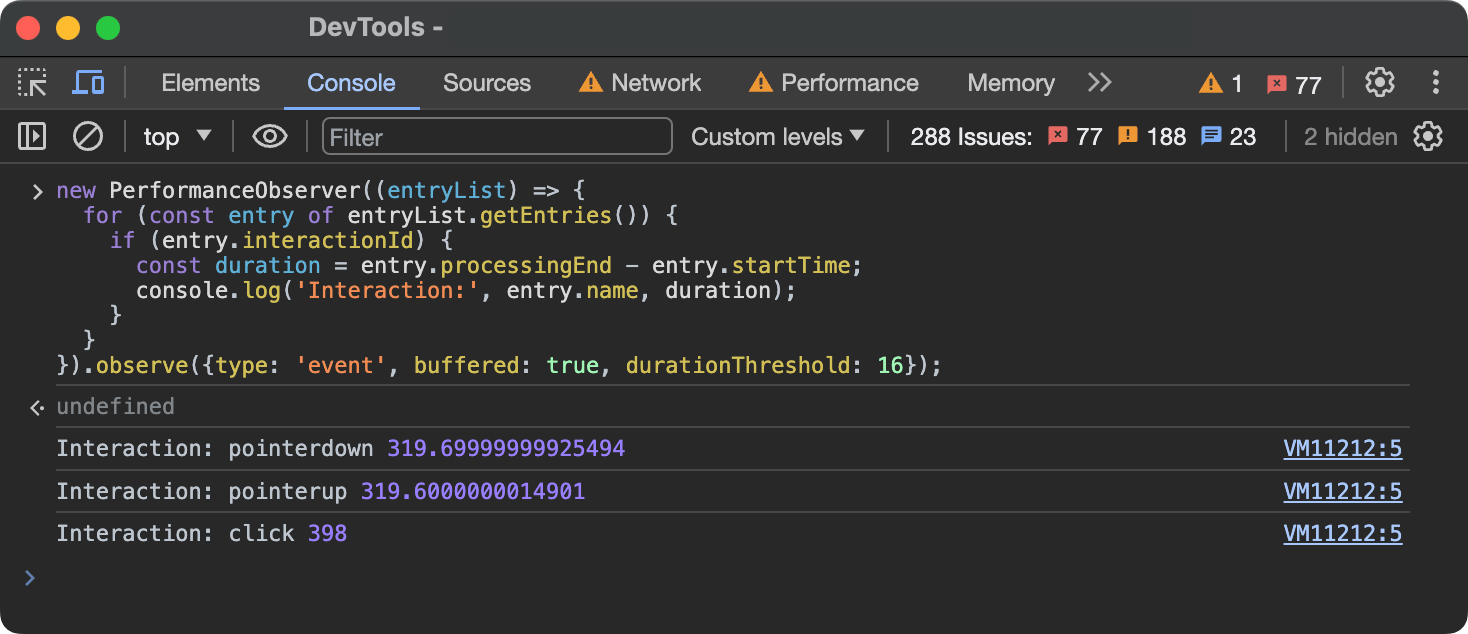
With my DevTools throttled, I clicked on a filter option on the category page and logged INP values to console:

Then I used Local Overrides in Chrome DevTools to yield to the main thread whenever the function a(b) was called using setTimeout():
// After — Don't use in production!
function a(b) {
    var c = b.target;
    if (c) {
        setTimeout(() => {
            var d = yy(c, "gtm.click");
            gz(d);
        }, 0);
    }
}
Interactions with the filter now appeared faster — the click interaction being almost 500 milliseconds faster.
Of course, you probably wouldn’t or shouldn’t use that solution in production. But the example showed that tag manager setup needed optimization.
Possible Solutions
- Only use a single tag manager with a single container per page
- Load the tag manager asynchronously
- Don’t load code that is needed immediately on a page (i.e. visual elements in the initial viewport, cookie banners)
- Regularly remove tags that are no longer needed
- Implement a performance budget for third-party code and a review process for new tags
- Optimize triggers
- Use server-side instead of client-side tagging
Conclusion
If you’re working on an e-commerce site, keep an eye on how performance metrics differ by page type. With regards to responsiveness, see how INP (and eventually Long Animation Frames) differ.
As our data showed, INP is worst on category pages due to three general patterns: re-routing when filtering products, small performance issues in product tiles that get compounded, and additional overhead from tag managers and third-party code. Keep those patterns in mind and help to mitigate the responsiveness issues they cause.

[…] Sluggish CATs: Category Pages Have the Worst Responsiveness (INP) on e-Commerce Sites […]
[…] Sluggish CATs: Category Pages Have the Worst Responsiveness (INP) on e-Commerce Sites […]
[…] Sluggish CATs: Category Pages Have the Worst Responsiveness (INP) on e-Commerce Sites […]
[…] Sluggish CATs: Category Pages Have the Worst Responsiveness (INP) on e-Commerce Sites […]
[…] Sluggish CATs: Class Pages Have the Worst Responsiveness (INP) on e-Commerce Websites […]
[…] Gradual CATs: Class Pages Have the Worst Responsiveness (INP) on e-Trade Websites […]
[…] in March 2024. INP has already been talked about a few times in this year’s Perf Calendar by Brian, Ivailo, and Sander, so if you need a refresher on what it is and how to optimize it, I’d […]