

Alistair Shepherd (@accudio@mastodon.scot) is a Front End Developer, working the full range of the web but particularly focusing on accessibility, performance and privacy. He works at the creative agency Series Eight as Lead Developer, building creative websites, ecommerce stores and web apps for businesses the world over. He blogs and speaks about performance and making the web simpler.
Web Performance can be a tricky business. There’s a huge number of moving parts in a modern website and it can be difficult to find, diagnose and fix performance issues correctly. What makes it easier is that lots of websites each face the same issues, at least before they’ve had a lot of optimisation work done!
I’ve been building, auditing, and improving the performance of websites in an agency for a while, and a large number of the sites I review all share the same handful of issues — issues that can be identified easily, fixed without much work, and make a significant impact without getting in-depth into the data and build.
I’ve compiled a list of ten performance tips that I start with for every site I build or audit. Not every website has them all, but it’s rare I encounter a site that doesn’t have at least a handful! This is a sample of each tip, but all have further reading with more information and details on diagnosing and implementation.
1. Test performance more
Testing sits at the heart of web performance, and the reason it’s here first is that without it we wouldn’t know the performance problems we have, nevermind how to fix them and whether those fixes will even work! Web performance is a bit of science — you first have to make measurements to see what you’re working with, and then analyse that data to work out your next steps. Using that data and analysis you can find and implement an improvement, once again experimenting and testing to ensure it’s had the positive impact you expected.
If you’re currently not doing any performance testing then don’t worry as it’s easy to get started. Browsers have some great in-built tools — Lighthouse within the Chromium developer tools is a great place to start. Given that you’re reading this calendar, you’re probably already doing some kind of testing already, but adding more layers of testing will be extremely useful to increase your data on and visibility of issues:
- Simple tools like Lighthouse, Pagespeed Insights and GTMetrix make it easy to do a quick performance test manually with suggestions of improvements.
- WebPageTest is an invaluable tool for performance testing that really lets you dig into the details of metrics, request times, network waterfall charts and more.
- You can get started with real-world user data from the Chrome User Experience Report, using tools like Treo, the CRUX history API or Google’s BigQuery.
- Services like Calibre, Speedcurve, Treo and Speedlify will regularly run automated lab tests for you that let you track performance over time.
- RUM tooling allows you to collect and analyse data from your own users, seeing how your website actually performs for real people.
- Lighthouse or other testing tools can be integrated into CI flows in order to test for performance regressions with code changes.
Not all of these tools and methods are necessarily needed for all websites and circumstances, but they can be extremely handy to identify performance issues so find what works best for you!
Further reading:
- ??A countdown of my top 5 favorite web performance tools — Sia Karamalegos, Web Performance Calendar (2022)
- The Three Types of Performance Testing — Harry Roberts 2018)
- Manually diagnose slow interactions in the lab — Jeremy Wagner, web.dev (2023)
2. Optimise your images as much as possible
Unless you already have perfectly optimised images, they are always the first place to look for performance improvements. For many websites the Largest Contentful Paint element is an image, and generally a huge amount of the total ‘weight’ of pages are images.
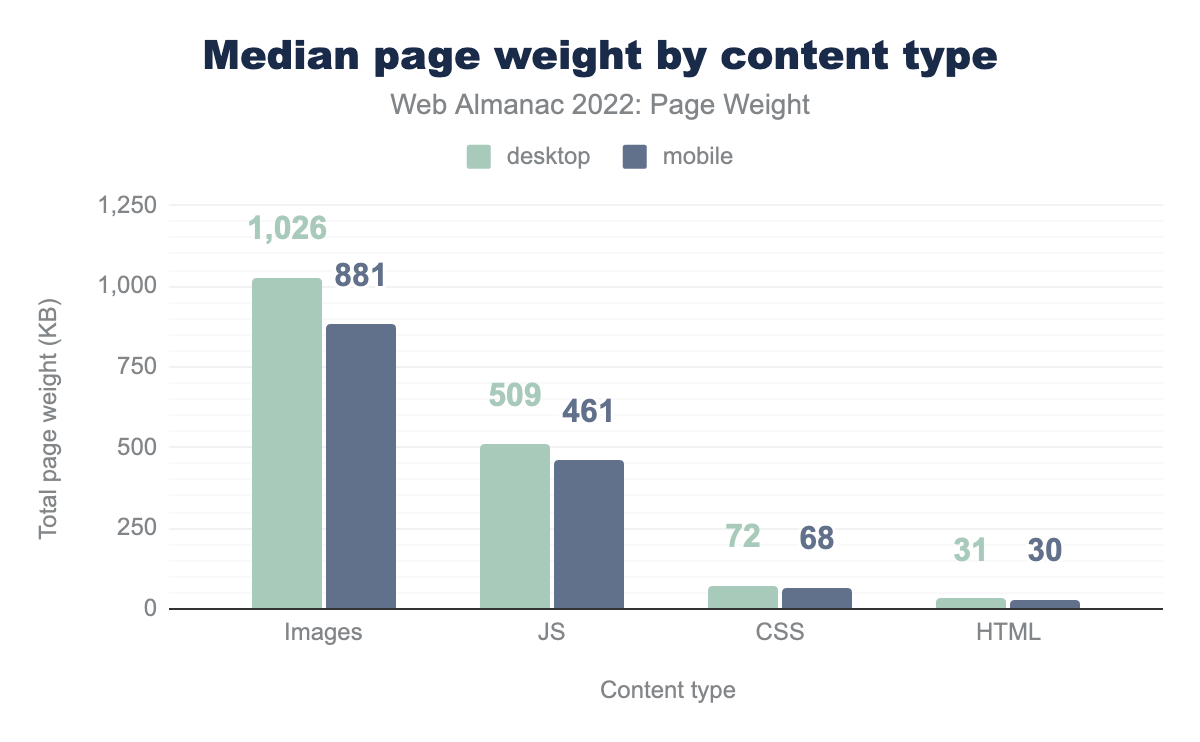
Median page weight by content type data from Web Almanac 2022
There are a few different things you can and should do when optimising images:
- Compress images to reduce file size at the cost of quality. If an 85% quality image at 100kB looks identical to a 100% one at 2MB it’s an easy choice;
- Convert to more recent image formats like WebP, AVIF or JpegXL. These formats may make certain images a lot smaller than their JPEG and PNG counterparts;
- Resize images to the exact size you need them, and use responsive images with srcset to offer smaller sizes. This way a browser doesn’t download a huge image it doesn’t need.
There are many different tools you can make use of for optimising your images. Manual processing tools like squoosh.app make it easy to convert, resize, and optimise images by hand; CMS platforms often include partial or full automatic optimisation; or you could consider an image CDN like Cloudinary, Imgix, or CloudImage to help optimise and resize images on request.
You can also use loading="lazy" on your image elements to wait until they’re in view and needed before downloading them. Priority Hints [anchor link to tip 10 heading] can also be used to ask the browser to prioritise downloading your LCP image sooner.
Further Reading:
- HTTP Archive Web Almanac 2022, Media– Eric Portis, Akshay Ranganath (2022)
- Responsive Images the Simple Way — Scott Vandehey, Cloudfour (2020)
- The Ultimate Guide to Image Optimisation — Karolina Szczur, Calibre (2023)
- Image Optimization (book) — Addy Osmani (2021)
- The Ultimate Guide To Responsive Images On The Web — Anna Monus, DebugBear (2023)
3. Reduce JavaScript where you can
JavaScript is the most expensive resource per-byte on the web, and is a really common bottleneck when used too much. Whilst HTML is a streaming language and CSS is parsed quite quickly, making your first render rely on JavaScript will delay how quickly users can start to see content.
JavaScript needs to be downloaded, parsed, and then executed before affecting your webpage. That cost is particularly significant on low-powered devices, where slower execution time can seriously impact the user experience. This is also saying nothing of the risk of making your webpage dependant on JavaScript, where a JavaScript failure or network issue may cause your website to be completely inoperable!
Where you can implement something in HTML or CSS then do so, and make sure your pages can start rendering without JavaScript. Additionally avoid unnecessary JS libraries and instead use built-in JavaScript APIs, progressive enhancement, or smaller and more performant libraries where possible.
Further Reading:
- HTTP Archive Web Almanac 2022, Javascript — Jeremy Wagner (2022)
- The Unbearable Weight of Massive JavaScript (talk) — Ryan Townsend (2023)
- Responsible JavaScript (book) — Jeremy Wagner (2021)
- HTML and CSS techniques to reduce your JavaScript — Anthony Ricaud, Web Performance Calendar (2020)
4. Watch out for third-parties
A common curse for those in performance is dealing with third-party code. Third-party code, tag managers, analytics tools, embeds, and more can have a huge impact on performance and are often added by marketing departments and out of the hands of engineers.
That said, do what you can! If third parties can be removed, consolidated, or replaced with more lightweight alternatives then this can have a big positive performance (and privacy!) impact. If that’s not possible, at least measure their impact to make sure everyone is aware of the trade-off.
On a personal note, you’ll be amazed at the number of marketing departments that have asked me to “fix their site speed” despite having at least 5 different tag managers running!
Further Reading:
- HTTP Archive Web Almanac 2022, Third Parties — Eugenia Zigisova (2022)
- Efficiently load third-party JavaScript — Milica Mihajlija, web.dev (2019)
- Identify slow third-party JavaScript — Milica Mihajlija, web.dev (2019)
- Best practices for tags and tag managers — Katie Hempenius, Barry Pollard, web.dev (2019)
5. Nail HTTP caching
In the words of Harry Roberts: “The best request is the one that’s never made”. A read from cache is much faster than a network request, so rely on the cache wherever possible for repeat visits.
Particularly for assets–where CSS, JS, and images do not change very often–we can use cache-control headers to allow the browser to cache and re-use our resources. If you’re careful you can even cache document resources like HTML and JSON to potentially avoid any network requests for a previously visited page!
Further Reading:
- Cache Rules Everything (talk) — Harry Roberts, 2023
- Prevent unnecessary network requests with the HTTP Cache — Web.dev, 2018
6. Optimise custom fonts
One of the biggest culprits for Cumulative Layout Shift issues is web fonts. With a poorly optimised web font you could encounter invisible or unstyled text, fonts swapping in the loading process, layout shifts moving content as fonts load in different sizes, or font requests delaying other important requests.
In an ideal performance world you could consider using a system font to avoid loading web fonts at all. However, in most cases we can significantly decrease the impact of our web fonts by optimising them to make them load faster and more smoothly. A few ways we can do this are:
- Serve the font from your origin/domain instead of a third-party;
- Limit the number of font files you need to load by reducing the number of weights you use. Do you really need a regular, medium and a semibold?
- Use
font-display:swap;within@font-faceto smooth the switch from fallback to custom fonts; - Subset fonts to just the characters you need with a tool like glyphhanger. If you have a website in only ASCII characters you can reduce your font sizes by up to 50%!
- Variable Fonts combine multiple font weights and styles into a single font file. Whilst it may be larger than a single non-variable font, it’ll generally be smaller than 3 traditional fonts.
- Preload the most important font or two using
<link rel="preload" as="font">
Depending on the licence of your font you may not be able to do all of the above — particularly subsetting or loading from your server — so make sure you double-check the font licence first. As Google Fonts are open-source you can do all of the above!
Further Reading:
- HTTP Archive Web Almanac 2022, Fonts — Bram Stein (2022)
- Speed Up Google Fonts — Harry Roberts (2020)
- Font Subsetting Strategies: Content-Based vs Alphabetical — Paul Hebert, Cloudfour (2022)
- It’s Dangerous to go Stallone. Take Glyphhanger — Zach Leatherman (2018)
7. Reduce TTFB and server response time
Once again quoting Harry Roberts: “While a good TTFB [time to first byte] doesn’t necessarily mean you will have a fast website, a bad TTFB almost certainly guarantees a slow one.”
If your website relies on a single, slow server then you may have bottlenecked your site performance on your server speed. If it takes 2 seconds before the browser receives the HTML to render then no matter how much you do on the front-end that’s going to be your limit. You can get an idea of this by looking at the Time to First Byte on a fast connection close to the server. The measured value depends on the systems and work being done, and you want to be as close to 0ms as possible, definitely under 500ms.
You can improve your Time to First Byte by optimising server and network setups to be as fast and close together as possible, or optimising your code to run more efficiently or utilise caching systems. A great strategy for sites that aren’t unique on every request is to implement a caching layer or CDN like Nginx, Varnish, Bunny CDN, Fastly, or KeyCDN to cache HTML that doesn’t often change.
Further Reading:
- Time to First Byte: What It Is and How to Improve It — Harry Roberts (2019)
- Time to First Byte: What it is and How to Make Improvements — Karolina Szczur, Calibre (2023)
- Optimise Time to First Byte — Jeremy Wagner, Barry Pollard, web.dev (2023)
- HTTP Archive Web Almanac 2022, CDN — Haren Bhandari, Joe Viggiano (2022)
8. Consolidate resources on the primary origin
Back in the day it was good advice to split up your assets across multiple origins/domains to deal with connection limits in HTTP 1, and to use public CDNs for shared caching. However this hasn’t been good advice for a long time now — since HTTP/2 has been commonly adopted.
Each new connection to a new origin imposes a time cost of DNS lookup, HTTP Connection and SSL negotiation at minimum. Your primary origin however already has a connection set up and HTTP/2 or 3 can easily handle those additional resources.
Previously browsers used to allow websites to re-use a cached resource with the same URL across different domains. Whilst allowing for potential performance benefits, this provided a way to track users across different origins. Now all browsers separate the cache of each origin so using a public CDN no longer provides any benefit to resource caching.
If you’re truly unable to move everything to the main origin, at least use preconnect to connect to those origins slightly faster.
Further Reading:
- Self-Host Your Static Assets — Harry Roberts (2019)
- Correctly Configure (Pre) Connections — Harry Roberts (2023)
- Self-hosting third-party resources: the good, the bad and the ugly — Anthony Barr�, Web Performance Calendar (2019)
- Say goodbye to resource-caching across sites and domains — Stefan Judis (2020)
9. Split assets to run only when needed
If you’re including all of your CSS and JS on your home page then you’re likely shipping CSS and JavaScript that is completely unneeded on initial load. Depending on how much those resources weigh, they may make a significant impact on the loading speed of the code that actually is being used on that page.
By splitting up your code to ensure it is only included where it is needed, you can make your page loads more efficient and faster. This needs to be balanced against caching and the cost of each individual request however, so make sure you analyse the results and carefully fine-tune the balance of code splitting vs caching for the best results.
Most browser developer tools include a way to view and analyse “code coverage” which will give you an idea of how much code isn’t being used on the current page. How you do this will depend on your build setup, with most build tools (including Webpack, Vite and RollUp) including automatic or manual methods for code-splitting.
Further Reading:
- Improving JavaScript Bundle Performance With Code-Splitting — Adrian Bece, Smashing Magazine (2022)
- Code-split JavaScript — Kevin Farrugia, Jeremy Wagner, web.dev (2023)
10. Fine-tune LCP with preloads and fetchpriority
Preloads are a way of gaining more control over how the browser loads resources. You can use them to fetch assets in advance of when they’re needed, or to make the browser prioritise one asset over another.
Be careful with this feature however, as preloading one asset will always delay the loading of something else, and can very easily make things worse unintentionally.
Preloads are particularly handy for font files, where the browser won’t start downloading them until the CSS has downloaded and rendering has begun. By preloading them, we can start that request earlier and mitigate layout shifts and font switches. Preloads can also be used for images or other assets that you’re finding the browser is discovered too late during load. Overall, they are extremely powerful and can really help you fine-tune the page loading process, however make sure to measure the results carefully to ensure they’re having the positive impact intended.
Further Reading:
- LCP attribution: a fetchpriority breakdown — Erwin Hofman, Web Performance Calendar (2022)
- Common Problems With rel=”preload” — DebugBear (2021)
- Optimizing resource loading with the Fetch Priority API — Addy Osmani, Leena Sohoni, Patrick Meenan, Barry Pollard, web.dev (2023)
Conclusion
This is far from a conclusive list, however these ten tips form a great first step in optimisation for me! It has been a fantastic start for lots of websites I’ve audited myself, and gives some great easy steps for any developer to make meaningful progress on performance no matter their experience.
This is just my list, if you have your own tips or issues that you see often let us know! Or better yet, write a “10 more performance tips” for the Web Performance Calendar 2024! 😉